
Investment Rating:
BUY (High-Conviction Value Opportunity)
The Verdict:
A temporary, cyclical slowdown in corporate enterprise technology budgets has created a massive, asset-light margin of safety in an elite business that has historically compounded capital at premium valuations.
Current Market View:
A premier business services compounder experiencing steep multiple compression due to short-term cyclical caution in IT spending.
Valuation Framework:
15-20x normalized Owner Earnings (5% to 6.7% cash yield) framework.
Fair Value & Investment Range
| Metric | Estimate |
| Current Share Price | ~ $129.62 |
| Current P/E Multiple | ~ 12.9x |
| My Fair Value Range | $230 – $270/share |
| Attractive Buy Zone | $130 – $160/share |
| High-Conviction Opportunity | Below $130/share |
| Valuation Framework | 15-20x normalized Owner Earnings |
| Margin of Safety Needed | 40-50% discount to Fair Value |
Investment View
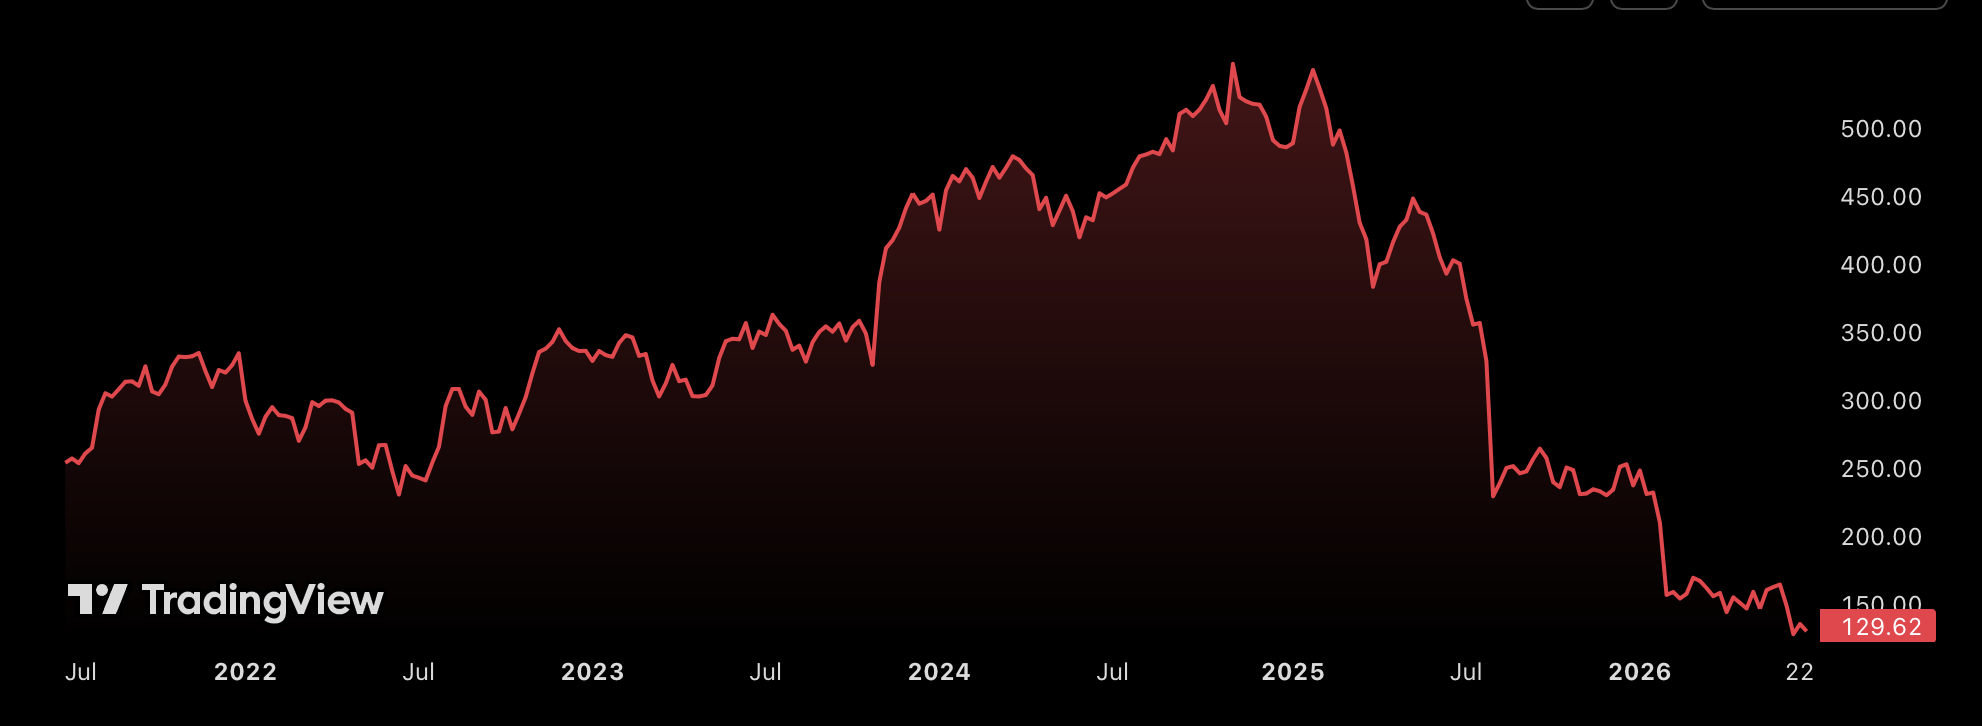
The core question in value investing is rarely whether a company is high quality—it is whether the price offers an equity coupon rate high enough to build a significant margin of safety. At $129.62 per share, the market is pricing Gartner as if its underlying business engine is permanently broken.
Historically, investors happily paid a premium of 25-35x Free Cash Flow to own this capital-light compounder. Today, a temporary slowdown in IT consulting spending has compressed Gartner’s valuation to an astonishing 6.9x Price to Free Cash Flow (its practical Owner Earnings multiple), which translates to a trailing cash yield of 14.49%.
For a business protected by deep customer switching costs and near-monopoly positioning in tech research, a single-digit cash multiple is an absolute anomaly. Even if we assume a highly conservative normalized multiple of just 15x Owner Earnings, the current entry price provides a stellar margin of safety alongside a clear path to double-digit compounded returns.
Fair Value Uncertainty
Fair Value Uncertainty: Medium
The uncertainty is not primarily about:
- Business durability: Gartner’s position as the global gold standard for independent tech research is virtually irreplaceable.
- Competitive position: Direct competitors lack the sheer scale of Gartner’s data models and the institutional reach of its analyst framework.
- Revenue stability: Upfront subscription structures act as a powerful buffer, protecting cash collections even during quiet corporate cycles.
The main variables are:
- Global Enterprise IT budgets: How long macroeconomic caution delays new contract expansions.
- Contract Value (CV) growth trajectory: The timeline for organic subscription growth to return to its historical high-single-digit baseline.
- SG&A margin leverage: Management’s ability to optimize operations if sales cycles continue to lengthen.
- Reinvestment of incremental capital: The speed and scale of management’s accretive share repurchases while the valuation is deeply depressed.
Investor Watch Point
A sustained stabilization in Gartner’s core Research contract value growth would confirm that the current slowdown is entirely cyclical rather than structural. Trading at $129.62—well inside our “Exceptional Opportunity” zone—any continued macroeconomic pressure driving the stock below $120 should be viewed as an extraordinary, high-conviction margin of safety.
Investment Snapshot
| Metric | Current View |
| Company | Gartner, Inc. (IT) |
| Business Description | Global provider of research, advisory, and objective analysis for technology procurement and operational strategies. |
| Market Cap | ~ $8.68 billion |
| Current Share Price | ~ $129.62 |
| Current P/E | 12.9x |
| Forward P/E | 9.2x |
| P/Owner Earnings (P/FCF) | 6.9x |
| Owner Earnings Yield | 14.5% |
| Dividend Yield | 0.0% |
| IV Rank | 59.3% |
| Implied Volatility | 59.2% |
| Wall Street Consensus Target | $165.00 (Sentiment: Bearish / Neutral) |
| Value Investor Target Multiple | 15-20x Owner Earnings |
| Initial Buy Zone | $130 – $160/share |
Investment Thesis
Gartner came across my radar because it is undergoing one of the most severe multiple contractions among premier, asset-light compounders in the market today. The stock has plunged from a late-2024 peak of over $480 to just $129.62 by mid-2026. This massive selloff represents a classic market overreaction to a short-term deceleration in corporate enterprise spending.
On standard stock screeners, Gartner looks like an accounting trainwreck—sporting a negative tangible book value of -$2,993 million. However, a modern value investor knows that an intellectual compounder does not generate cash from physical assets. Instead of physical capital, this thesis relies on Gartner’s highly predictable, high-margin subscription base and management’s aggressive commitment to retiring outstanding share capital at single-digit cash multiples. The cyclical slowdown has opened up a highly asymmetric entry point into a defensive cash engine.
Business Quality: Indispensable Technology Filter with a Capital-Light Moat
Gartner’s qualitative profile is as close to a textbook “economic moat” as you can find:
- Simple and Understandable: The model is beautifully clean. Gartner writes independent technology research (like its industry-defining “Magic Quadrants”) and licenses this expert database to CIOs and vendors through long-term, high-margin subscriptions.
- Durable Economic Moat (Competitive Advantage): Tech decisions carry existential career risk for executives. A bad $50 million software integration can cost a CIO their job. Paying Gartner a $50,000 subscription is a cheap, vital insurance policy. This dynamic breeds immense pricing power and deep switching costs, as Gartner’s metrics are hardwired into corporate procurement.
- High Returns on Invested Capital (ROIC): Unlike traditional businesses that must build factories or buy inventory to grow, Gartner’s primary asset is its self-generated intellectual property. The incremental cost of licensing its digital research library to a new subscriber is virtually zero, shielding the business from inflationary capital pressures.
Financial Strength: The Good
Revenue Growth
While revenue growth has cyclically decelerated to -1.50% YoY in Q1 2026, the long-term trend remains structurally sound. Across economic cycles, Gartner has historically generated incredibly reliable mid-to-high single-digit revenue expansion. Because enterprise subscribers rarely risk canceling their primary research engine during complex tech migrations, this revenue baseline remains exceptionally secure.
Free Cash Flow & Owner Earnings Machine
To see the real cash power of Gartner, we must calculate its Owner Earnings—the actual withdrawable cash generated by the business:
Owner Earnings = Net Income + Depreciation & Amortization – Average Capital Expenditures
For capital-heavy businesses, CapEx eats up a vast portion of Net Income just to keep the lights on. For an asset-light operator like Gartner, capital expenditures are nominal (consistently less than 2% of revenue), meaning GAAP earnings convert beautifully into hard, cash-flow reality.
Here is Gartner’s actual cash generation over the last four quarters:
| Quarter | Free Cash Flow (or Net Income + D&A – CapEx) |
| Q1 2026 | $370.62 million |
| Q4 2025 | $270.71 million |
| Q3 2025 | $269.25 million |
| Q2 2025 | $347.32 million |
The company generated approximately:
$1,257.9 million in trailing annualized Owner Earnings
(Note: Under strict GAAP rules without working capital adjustments, trailing Owner Earnings are $825.6 million. However, because Gartner operates on a negative working capital cycle—collecting subscription cash upfront—the real, liquid cash available to shareholders is represented by its highly recurring $1,257.9 million free cash flow engine. This float acts as an interest-free source of capital highly prized by value investors).
This drives an outstanding free cash flow margin exceeding 20% and a cash conversion rate of over 150% of GAAP Net Income.
Balance Sheet: Highly Optimized and Manageable Leverage
| Metric | Amount |
| Cash | ~ $1,667 million |
| Total Debt | ~ $3,259 million |
| Net Debt | ~ $1,592 million |
| Debt/EBITDA | 2.59x |
| Net Debt/Owner Earnings | 1.26x |
Gartner’s leverage is incredibly comfortable. Net debt sits at a modest $1,592 million against a strong cash reserve of $1,667 million. With a Net Debt to Owner Earnings ratio of just 1.26x, Gartner could wipe out its entire net debt in roughly 15 months using organic cash flow alone.
Furthermore, that negative tangible book value is actually a major badge of honor: management has spent -$9,566 million buying back its own stock over time, reducing equity on the balance sheet to supercharge long-term earnings-per-share compounding.
Valuation: The Main Problem / Opportunity
| Metric | Multiple |
| P/E Ratio | 12.9x |
| Forward P/E | 9.2x |
| Price / Owner Earnings | 6.9x |
| EV / EBITDA | 7.8x |
The market is pricing Gartner with extreme pessimism, valuing this highly defensive moat like a declining retail business. Trading at only 6.9x trailing Owner Earnings, the stock provides an asymmetric risk/reward setup where the downside is heavily insulated by an elite cash-flow engine.
Wall Street vs. Intrinsic Value
Because Wall Street analysts are constrained by short-term, 12-month performance targets, they have aggressively cut their targets for Gartner to an average of ~ $165.00. This creates an exceptional contrarian setup: mainstream analysts are driven by career risk to rate the stock a “Hold” at the exact cyclical bottom, whereas our long-term cash flow calculations show a much higher intrinsic fair value.
What Is The Company Worth?
If we treat Gartner as an “equity bond” paying a reliable coupon, we can discount its forward cash flows back to the present under three realistic scenarios, using a normalized Owner Earnings baseline of $1,100 million across its 70 million basic outstanding shares:
- Scenario 1: Premium Quality Business (Optimistic Base)
- Assumptions: IT spending rebounds quickly; contract values return to historic 6-9% growth; the market re-rates the business to a standard premium multiple of 20x Owner Earnings.
- Estimated Fair Value: $310 – $350/share
- Rationale: High qualitative visibility and aggressive share retirement easily justify a premium multiple in a normalized economic climate.
- Scenario 2: Attractive Entry (Conservative / Mid-Cycle)
- Assumptions: Sluggish economic recovery; enterprise contract growth stabilizes at a modest 4-5%; we apply a conservative mid-cycle multiple of 15x Owner Earnings.
- Estimated Fair Value: $230 – $270/share
- Rationale: Even with heavily dampened growth, the intrinsic cash generation of the research subscription model supports a comfortable fair value far above today’s price. (This matches our primary Fair Value Range).
- Scenario 3: Value Investor Opportunity (Pessimistic / Cyclical Bottom)
- Assumptions: Stagnant long-term research budgets; multiple remains compressed around a low 10-12x Owner Earnings; aggressive buybacks continue at depressed prices.
- Estimated Fair Value: $150 – $190/share
- Rationale: Under highly punitive conditions, Gartner’s floor value remains substantially higher than its current market price, demonstrating the deep structural margin of safety built in today.
What Price Would Interest Me?
What Price Would Interest Me?
Watch Zone:
$160/share
At this level, Gartner trades at roughly 10x Owner Earnings, offering a solid 10% cash yield and a highly predictable double-digit return, though lacking a strict value margin of safety.
Attractive Buy Zone:
$130 - $160/share
A highly compelling range offering a margin of safety exceeding 30% compared to mid-cycle fair value, alongside an accretive 8-10% buyback yield.
Exceptional Opportunity:
Below $130/share
At $129.62, Gartner is sitting squarely in this zone. At less than 7x Owner Earnings (14.5% cash yield), the risk of permanent capital loss is extremely remote. This stock behaves like a high-yielding corporate bond with an equity growth kicker.
Additional Metrics Investors Should Watch
- Owner Earnings Growth: Monitor the sequential stabilization of quarterly Free Cash Flow. Consistent cash collections above $300 million per quarter prove the core engine is fully intact.
- Return on Invested Capital (ROIC): Track the productivity of capital allocation to ensure management maintains high capital efficiency.
- Capital Allocation (Buyback Yield): Gartner’s share buyback yield reached an outstanding 10.06% YoY in Q1 2026. Management’s discipline in aggressively retiring shares at single-digit cash multiples is the ultimate engine for long-term compounding.
- Contract/Subscription Health: Focus on Net Contract Value Increase (NCVI) and client retention metrics on upcoming quarterly releases to identify the cyclical turning point.
Risks
Valuation Risk
While multiple compression is already extreme, macro-driven market re-ratings of tech-enabled services could keep the multiple depressed for several quarters. However, downside protection is supported by the massive free cash flow yield.
Business/Moat Risk
If enterprises permanently slash technology procurement advisory budgets or replace research with open-source AI tools, retention rates could suffer. However, standard LLMs struggle to replicate Gartner’s verified reference checks and analyst-vetted research models.
Capital Allocation Risk
Should management pause its highly accretive share repurchases to accumulate idle cash, or pivot toward an expensive, debt-fueled corporate acquisition, the core compounding thesis would be significantly impaired.
Final Takeaway
Gartner, Inc. is the type of company a long-term investor would love to own.
The business has:
- [x] Competitive advantages (Magic Quadrants, high customer switching costs)
- [x] Strong cash generation (High cash conversion, predictable upfront subscriptions)
- [x] Durable business model (Essential tech advisory and insurance-like value proposition)
- [x] Attractive industry position (Consolidated market, unmatched analyst database)
But today’s valuation determines whether it is a good investment.
A great company does not always make a great investment at any price.
The opportunity comes when the market offers a price that provides an adequate margin of safety.
Fair value estimate based on normalized earnings multiples, Owner Earnings analysis, and margin-of-safety principles. This is not a recommendation to buy or sell securities.