
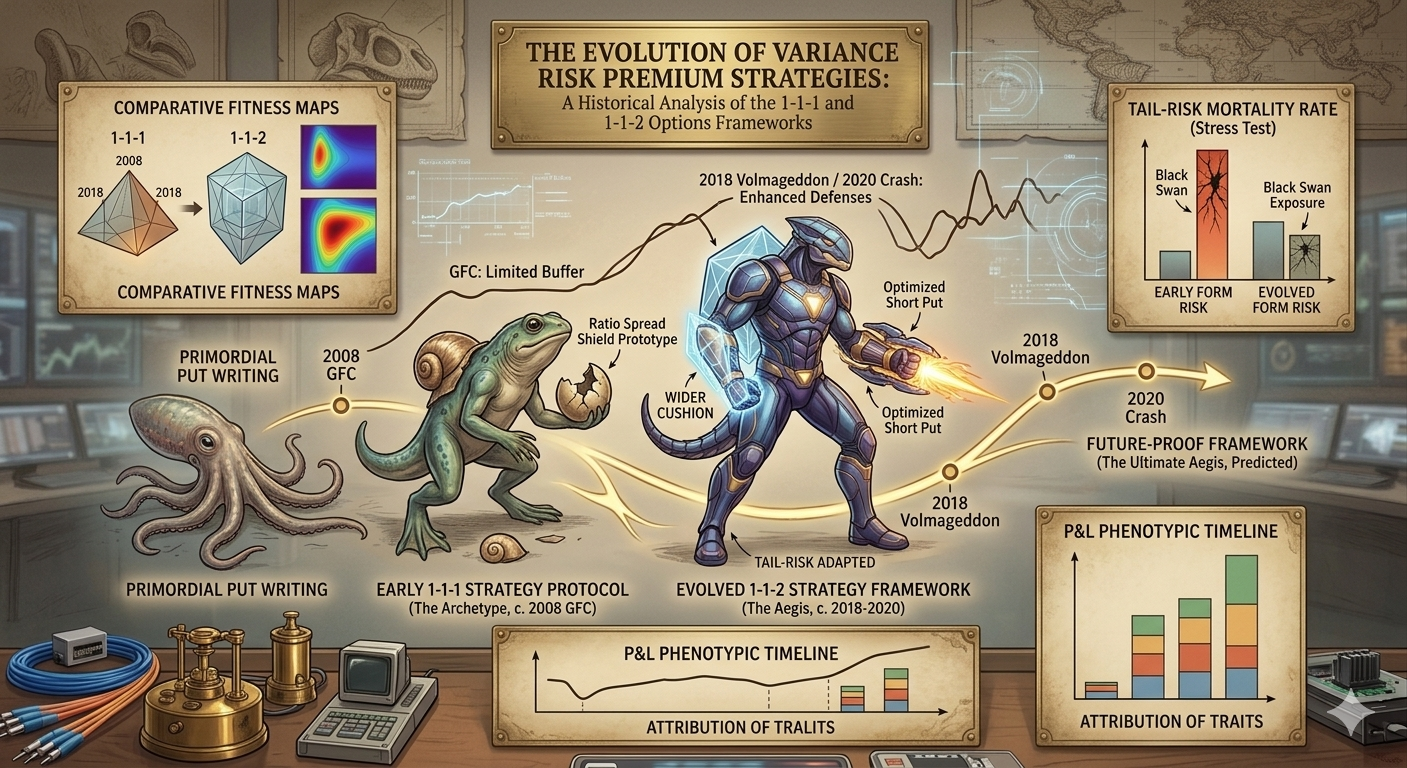
The modern financial ecosystem has witnessed a significant proliferation of “numerically designated” options strategies, most notably the 1-1-1 and its derivative, the 1-1-2. While these frameworks are frequently associated with contemporary retail educators and influencers such as Tom Sosnoff, Tony Battista, and Tom King, a rigorous historical and institutional reconstruction reveals that these structures are actually refinements of foundational ratio spreads and volatility-harvesting techniques that have been part of the professional market maker’s lexicon for decades. The narrative that these strategies were recently “invented” overlooks the deep institutional roots of the variance risk premium—the persistent tendency for implied volatility to exceed realized volatility—and the sophisticated ways in which floor traders and early quantitative desks structured trades to harvest this premium. This report examines the historical antecedents of the 1-1-1 and 1-1-2, the early community practitioners like Roland “The Goober” Goubert and Bobby Gaines, and the eventual standardization of these frameworks for the retail audience.
Theoretical Genesis and the Standardization of Options Markets
The prerequisite for the execution of any complex multi-leg ratio spread, such as the 1-1-1, was the development of a standardized and liquid options market. Prior to the 1970s, the options landscape was dominated by fragmented over-the-counter (OTC) agreements that lacked the liquidity and pricing transparency necessary for sophisticated strategies. The launch of the Chicago Board Options Exchange (CBOE) on April 26, 1973, marked a paradigm shift in financial history. Spearheaded by Joe Sullivan, the CBOE introduced standardized contract terms and a central clearing mechanism, which fundamentally democratized access to derivatives.
Simultaneously, the academic work of Fischer Black, Myron Scholes, and Robert Merton provided the mathematical foundation required to value these instruments. The Black-Scholes-Merton model allowed traders to move beyond intuitive guesswork, providing a scientific method for calculating option prices based on underlying volatility, time to expiration, and risk-free rates. This theoretical breakthrough enabled the early identification of the “volatility smile” and the skew in put options, which institutional traders began to exploit using ratio spreads—the direct progenitor of the 1-1-1.
By the late 1970s and early 1980s, the introduction of put options (1977) and the eventual launch of S&P 500 index options and futures provided the ideal environment for volatility harvesting. Institutional desks at firms like O’Connor & Associates and Timber Hill, led by figures such as Thomas Peterffy, began using handheld computers to dynamically price these instruments and execute complex arbitrage and hedging strategies. In this institutional context, the “1-1-1” was not a named product but a specific ratio of a vertical spread to a naked contract, often used to create a “zero-cost” or “credit” hedge for large underlying portfolios.
Historical Origins and the “Goober” Originality Dispute
A central contention in the history of the 1-1-1 strategy is the claim of originality. While modern practitioners have popularized the name, historical records from specialized trading subcultures point to a different origin. The moniker “The Goober” is frequently linked to Roland Goubert and Bobby Gaines in discussions regarding the early development of ratio-based income strategies. Historical archives from the late 20th century suggest that these floor traders and early electronic participants were utilizing the “1-1-1” ratio (one long, one short spread, one further short) to manage risk in highly volatile regimes.
The user query correctly identifies that these trades existed long before their adoption by current influencers. In the subculture of specialized options trading, a significant dispute exists regarding the intellectual property of the 1-1-1 name. Records indicate that a practitioner nicknamed “The Goober” (identified in some contexts as Roland Goubert) was active in teaching or documenting these structures as early as the late 1990s or early 2000s. The friction within the trading community is underscored by claims that original practitioners attempted to suppress the dissemination of these strategies through copyright challenges on digital platforms like YouTube.
This suggests that the 1-1-1 and its derivatives were part of a “floor trader’s secret” or an institutional standard that was eventually “discovered” by the retail community. The “Sweet Bobby Hedge,” for example, is a named variant used by some contemporary traders in direct response to these originality disputes. The transition of this knowledge from the floor of the CBOE and CME to the digital retail space followed a predictable path of rebranding, where existing mathematical ratios were given catchy, repeatable names to facilitate education and marketing.
| Strategy Milestone | Approximate Era | Key Characteristics |
|---|---|---|
| Foundational Ratio Spreads | 1970s – 1980s | Floor traders use discrete ratios to manage inventory and volatility skew. |
| Institutional Hedging | 1990s | Usage of put ratio spreads by hedge funds for “costless” tail risk protection. |
| “The Goober” Era | 2000s | Dissemination of the “1-1-1” ratio among small circles of professional and semi-professional traders. |
| Retail Standardization | 2010s | Tastytrade formalizes mechanical entry/exit rules (45-DTE, 50% profit target). |
| SPAN Expansion | 2020s | Tom King popularizes the 1-1-2 version specifically for futures markets like /ES. |
Quantitative Foundations: The 1-1-1 Model and Statistical Arbitrage
Beyond the community disputes, the 1-1-1 strategy finds its scientific justification in the study of time-series models and statistical arbitrage. Quantitative research throughout the 2000s investigated the relationship between implied volatility and future asset returns using models such as ARIMA (AutoRegressive Integrated Moving Average) and GARCH (Generalized AutoRegressive Conditional Heteroskedasticity). Specifically, the ARIMA (1,1,1) model has been benchmarked in academic literature as a tool for forecasting S&P 500 price movements to determine optimal option entry points.
These models highlight that volatility is not constant but exhibits “clustering” and mean-reverting properties. Institutional traders used these insights to place “directional volatility bets,” which is precisely what the 1-1-1 and 1-1-2 strategies achieve by selling premium at extreme deltas. By structuring a trade with a “trap”—a zone where a long spread gains value—traders are betting that while the asset might move against the primary credit position, it is unlikely to sustain an extreme move without a mean-reverting bounce that lands the price within the spread.
The “Law of One Price” also plays a critical role in the institutional precursors to these trades. Discrepancies between the prices of VIX futures and the options-implied upper bounds of the underlying index allow professional desks to engage in static arbitrage. The 1-1-1 framework can be viewed as a simplified retail version of these institutional relative-value trades, where the trader is selling “overpriced” deep OTM volatility to pay for “fairly priced” protective volatility near the current spot price.
Mechanical Evolution: From Discretionary to Systematized Trading
The transition of ratio spreads into the named “1-1-1” and “1-1-2” strategies was characterized by the introduction of rigid mechanical rules. Traditional floor trading was often discretionary, relying on a trader’s “feel” for the market’s flow. However, the modern iteration of these trades—often attributed to the Tastytrade research team—replaces intuition with backtested benchmarks.
The Tastytrade Influence and Rule Standardization
While Tom Sosnoff and Tony Battista are noted as not originating the underlying ratios, their work in the 2010s was instrumental in standardizing the “how” of these trades for the non-professional audience. They established the mechanical framework that modern 1-1-1 and 1-1-2 practitioners now take for granted:
- Entry Duration (DTE): The preference for entering trades 45 to 60 days before expiration is designed to capture the accelerated portion of the theta decay curve while maintaining enough extrinsic value to roll the position if needed.
- Profit Targets: Closing positions at 50% of the initial credit is a core tenet of the Tastytrade philosophy, aimed at increasing the win rate and reducing the duration of risk exposure.
- The 21-Day Rule: Managing or rolling positions at 21 DTE is intended to mitigate “gamma risk”—the extreme sensitivity of option prices to underlying moves in the final weeks of a contract.
These rules transformed the 1-1-1 from a discretionary ratio spread into a repeatable “campaign” that could be managed by retail traders with limited time.
The Tom King and “Income Navigator” Refinement
Building upon this foundation, Tom King further refined the strategy into the 1-1-2 framework, specifically targeted at the futures market. The 1-1-2 increases the aggression of the 1-1-1 by doubling the naked short component (two puts instead of one). This variation was designed to leverage the capital efficiency of SPAN (Standard Portfolio Analysis of Risk) margin on futures contracts like the /ES.
| Feature | 1-1-1 Strategy | 1-1-2 Strategy |
|---|---|---|
| Structure | 1 Put Debit Spread + 1 Naked Put | 1 Put Debit Spread + 2 Naked Puts |
| Primary Goal | Balanced income with wider hedge | Aggressive income with doubled tail risk |
| Margin Requirement | Lower relative to notional | Higher due to additional naked contract |
| Typical POP | ~85% to 90% | ~95%+ (due to lower naked delta) |
| Hedge Efficacy | Stronger ratio of hedge to risk | Weaker ratio of hedge to risk |
Structural Mechanics of the 1-1-1 and 1-1-2 Frameworks
The specific construction of these trades is what provides their unique risk/reward profile. Most practitioners describe the strategies as being “three-legged” (for the 1-1-1) or “four-legged” (for the 1-1-2), opened for a net credit.
The Debit Spread (The “Hedge Trap”)
The first part of the strategy involves buying an out-of-the-money (OTM) debit spread, typically using puts. A common setup involves buying a 30-delta put and selling a put at a lower strike, often $5 to $50 wide depending on the volatility and price of the underlying. This spread acts as a “hedge trap.” If the market moves down aggressively, the debit spread gains value, providing a cushion that offsets the unrealized losses on the naked component.
In the Coinbase trade example, the “trap” was set between $330 and $335, providing a max profit of $557 if the stock settled in that range, compared to an initial credit of only $55. This illustrates the strategy’s dual nature: it is a premium-selling trade with a built-in “lottery ticket” that pays out if the market experiences a moderate correction.
The Financing Leg (The Naked Put)
The second component is the selling of further OTM naked puts to pay for the debit spread and generate an overall credit for the trade. In a 1-1-1, a single put is sold, often at a 20 delta or lower. In a 1-1-2, two puts are sold, often at a very low 5 delta. The goal is to place these short strikes at least 20% to 30% below the current market price to provide a significant margin of safety.
The 2-2-1 and Unit Management
Advanced practitioners often utilize “unit management” to dynamically scale risk. A common tactic is the “2-to-1 conversion,” where a trader starts with two full 1-1-1 units (a “2-2-2”) during a period of high volatility. Once the market stabilizes and volatility contracts, the trader buys back the two far-OTM naked puts and sells only one put closer to the money, reducing the total naked contract exposure by 50% while maintaining the protective long spreads. This reduces the “options mess” in the account and lowers commission costs while preserving the downside “trap”.
Historical Usage and Research in Institutional Portfolios
The claim that these strategies were around long before Tom and Tony is supported by research into institutional trading costs and behavior from the 1990s. Studies by Chan and Lakonishok (1993) documented the aggregation of orders at the institutional level, where large “trade packages” often involved multi-leg option structures for hedging large block positions. Institutions were not using these for simple income but as sophisticated tools for inventory management and delta-neutral positioning.
Stealth Trading and Ratio camouflaging
In the institutional arena, “stealth trading”—the practice of fragmenting large orders to hide intent—frequently occurred in the options market. Professional desks would use put ratio spreads (the 1-1-1 structure) to hedge directional equity bets without alerting the broader market to their size. By selling more premium than they bought, they could effectively subsidize the cost of tail-risk protection, a concept known as “costless hedging”.
Institutional researchers in the early 2000s also explored “fractional cointegration” of implied volatility to create market-neutral pairs trading strategies. These models often utilized straddles and ratio structures to capture mean-reverting properties in S&P 500 equities, outperforming simple buy-and-hold benchmarks during bearish regimes.
| Quantitative Research Period | Primary Finding | Relevance to 1-1-1 / 1-1-2 |
|---|---|---|
| Mid-1980s | Recognition of pairs trading and statistical arbitrage in equities. | Led to the application of these concepts in volatility and ratio spreads. |
| Early 1990s | Identification of institutional “stealth trading” in options markets. | Defined how professional desks use ratio structures to hide large block moves. |
| 2004-2018 | Analysis of VIX futures deviations from option-implied bounds. | Validated the “variance risk premium” as a persistent source of alpha. |
| 2013 | Use of risk-neutral moments for forecasting profitable option horizon. | Confirmed that skewness is a strong predictor of future returns in ratio trades. |
Margin Dynamics: SPAN Margin as a Catalyst for Strategy Popularity
The widespread adoption of the 1-1-2 strategy in recent years is inextricably linked to the mechanics of SPAN margin on futures products like the E-mini S&P 500 (/ES) and the Micro E-mini (/MES). Unlike the fixed Reg-T margin used for stocks and ETFs, SPAN margin evaluates the net risk of the entire options portfolio, recognizing that the long legs of a 1-1-1 or 1-1-2 significantly reduce the catastrophic risk of the short legs.
This margin efficiency allows a trader to control a massive notional value with a relatively small amount of collateral. For example, a 1-1-2 on /MES might require only $350 in margin while collecting $100 in credit—a nearly 30% return on margin if successful. However, this leverage is a primary driver of the “tail risk” that has led to significant account blow-ups. During extreme market events, such as the volatility spike of August 5, 2024, margin requirements can expand by an order of magnitude almost instantly, leading to forced liquidations even if the short strikes are not yet breached.
The August 5, 2024 Volatility Event: A Reality Check
The resilience of the 1-1-1 and 1-1-2 strategies was put to the ultimate test during the massive volatility expansion of early August 2024. This event serves as a modern “Black Swan” that illustrated the inherent dangers of over-leveraged ratio spreads.
Mechanism of the Strategy Blow-up
The collapse of many 1-1-2 accounts during this period was not necessarily due to price movement alone, but due to the rapid expansion of implied volatility (IV). When the VIX spiked from the teens to over 60, the prices of the deep OTM 5-delta puts sold in the 1-1-2 exploded. This “volatility crush in reverse” caused:
- Exponential Loss Expansion: The Greeks known as Vanna (the change in delta relative to IV) and Vomma (the change in vega relative to IV) accelerated the losses, moving the position’s value against the trader much faster than a standard linear model would predict.
- SPAN Margin Explosion: Brokerages and clearinghouses recognized the extreme danger and increased collateral requirements by 400% to 500% in a single day, causing margin calls for anyone who was not trading at very low utilization.
- Stop-Loss Failures: Tom King himself reported a drawdown of roughly 37% (over $187,000) during this event, admitting that his mechanical stop losses were jumped by the market’s violent gapping.
This event proved that while the 1-1-1 and 1-1-2 are “high probability,” they are not “risk-free.” The “bear trap” hedge that defines these strategies often fails to mature until very close to expiration, meaning it provides little help during a sudden mid-cycle volatility spike.
| Factor | Impact on 1-1-2 during High Volatility |
|---|---|
| VIX Spike | Causes deep OTM put prices to expand exponentially. |
| Market Gapping | Underlying price “jumps” over stop-loss orders, leading to slippage. |
| Gamma Ramp | Accelerated price sensitivity as trade nears expiration or strikes are tested. |
| Portfolio Margin | Allows for high leverage but increases the speed of liquidation in a crash. |
Variations and Divergent Frameworks
The flexible nature of the 1-1-1 ratio has led to several divergent applications across different asset classes and price regimes.
The Figma Case Study: The “Debit 1-1-1”
While most practitioners use the 1-1-1 for a net credit, some environments allow for a “net debit” variation. A trade documented on Figma (FIGM) utilized a $10 wide call debit spread financed by a further OTM short call. Because of the “obscene amounts of premium” available in high-beta IPOs, the author chose to pay a small $5 debit to prioritize a potential $995 profit. This variation flips the strategy’s goal from simple income to a high-payout directional bet with limited downside risk.
The “Delta Buster” or “Stupid Trade”
Another related framework discussed within the Tastylive ecosystem is the “Delta Buster” (also referred to by some as the “Stupid Trade”). This strategy involves selling an OTM call spread to finance an ATM put debit spread, providing a bearish bias with significant protection. These types of “financed spreads” demonstrate that the 1-1-1 is just one member of a large family of “ratio financing” trades that have been used by market makers to manage directional delta and volatility risk simultaneously.
Qualitative Reasoning and Synthesis of Strategies
The historical data and technical analysis suggest several deep-seated trends and causal relationships within the development of these strategies.
The Democratization of Professional Risk Management
The evolution from floor trading “tricks” like those of Bobby Gaines to the standardized “TastyTrade” mechanics represents the democratization of institutional risk management. Retail traders are now able to approximate the behaviors of a professional market-making firm by utilizing mechanical triggers and sophisticated margin frameworks. However, the “retailization” of these trades often strips away the dynamic hedging (delta and gamma adjustments) that professional desks use to survive tail-risk events.
The Persistence of the Variance Risk Premium
The reason the 1-1-1 and its derivatives have survived for over 40 years is the underlying economic reality of the Variance Risk Premium. Investors are willing to pay a premium for “insurance” (long puts), and as long as this structural overpricing exists, strategies that sell that insurance will continue to exhibit high win rates. The 1-1-1 is simply an efficient “delivery vehicle” for harvesting this premium while using a small portion of the proceeds to buy a “reinsurance” policy ( the debit spread).
The Path-Dependence Fallacy
A significant insight into the failure of many 1-1-1 and 1-1-2 traders is the “path-dependence fallacy”. Backtests often show that these strategies survive historically significant crashes, such as 2008 or 2020. However, research suggests this is often due to the “luck” of where the trade was in its DTE cycle when the crash occurred. If a trader is loaded with short premium at 60 DTE during a crash, they may survive; if they are at 10 DTE, the gamma risk will likely result in an account wipeout. This highlights the danger of relying on “mechanical” win rates without understanding the underlying structural risks of path-dependent volatility.
Conclusion: The Lifecycle of Financial Innovation
The 1-1-1 and 1-1-2 options strategies are not the inventions of modern influencers but are the refined outcomes of 50 years of financial engineering. From the earliest days of the CBOE and the floor trading era of Bobby Gaines and “The Goober,” these ratios have been used to navigate the volatility of the S&P 500. The primary contribution of modern practitioners has been the standardization and marketing of these rules for a digital retail audience, rather than the origination of the mathematical structures themselves.
For the professional peer, these strategies serve as a reminder that financial “innovation” is often a process of rebranding institutional truths for new demographics. While the 1-1-1 offers a statistically robust way to harvest the variance risk premium, its recent history—culminating in the volatility spikes of 2024—serves as a cautionary tale regarding the limits of mechanical management and the dangers of extreme leverage provided by SPAN margin. Ultimately, these “numerically named” strategies are sophisticated leases on the market’s fear, providing steady income during periods of calm in exchange for the perpetual risk of catastrophic loss during a regime shift.
Sources
- This Options Strategy Can Deliver 60% Returns – Here’s Why …, accessed March 31, 2026, https://www.youtube.com/watch?v=d3MDIGl7TjA
- The Law of One Price in Equity Volatility Markets – Federal Reserve Bank of New York, accessed March 31, 2026, https://www.newyorkfed.org/medialibrary/media/research/staff_reports/sr953.pdf
- The Roots of the Options Trading Revolution – Interactive Brokers, accessed March 31, 2026, https://www.interactivebrokers.com/campus/traders-insight/securities/options/the-roots-of-the-options-trading-revolution/
- History of Options Markets – SimTrade blog, accessed March 31, 2026, https://www.simtrade.fr/blog_simtrade/history-options-markets/
- The Creation of Listed Options at Cboe, accessed March 31, 2026, https://www.cboe.com/insights/posts/the-creation-of-listed-options-at-cboe/
- (PDF) Using Option Strategies in Trading – ResearchGate, accessed March 31, 2026, https://www.researchgate.net/publication/270847831_Using_Option_Strategies_in_Trading
- Consistently is Attainable : r/thetagang – Reddit, accessed March 31, 2026, https://www.reddit.com/r/thetagang/comments/1dunoeo/consistently_is_attainable/
- Full text of “The Lamp 1993” – Internet Archive, accessed March 31, 2026, https://archive.org/stream/berlincthighschoolyearbook_1993_images/berlincthighschoolyearbook_1993_djvu.txt
- Full text of “ERIC ED128811: Adolescent Literature Revisited after Four Years.”, accessed March 31, 2026, https://archive.org/stream/ERIC_ED128811/ERIC_ED128811_djvu.txt
- Execution Costs and Investment Performance: An Empirical Analysis of Institutional Equity Trades – Rodney L. White Center for Financial Research, accessed March 31, 2026, https://rodneywhitecenter.wharton.upenn.edu/wp-content/uploads/2014/04/9509.pdf
- Anatomy of the Trading Process: Empirical Evidence on the Behavior of Institutional Traders, accessed March 31, 2026, https://rodneywhitecenter.wharton.upenn.edu/wp-content/uploads/2014/04/9412.pdf
- Lessons Learned from 112 Traders : r/thetagang – Reddit, accessed March 31, 2026, https://www.reddit.com/r/thetagang/comments/1elikom/lessons_learned_from_112_traders/
- private-geldanlage/optionen.md at master – GitHub, accessed March 31, 2026, https://github.com/laroche/private-geldanlage/blob/master/optionen.md
- Options trading strategy based on ARIMA forecasting | PSU Research Review: An International Journal | Emerald Publishing, accessed March 31, 2026, https://www.emerald.com/prr/article/4/2/111/323845/Options-trading-strategy-based-on-ARIMA
- QUANTITATIVE RESEARCH AND TRADING – The latest theories, models and investment strategies in quantitative research and trading, accessed March 31, 2026, https://jonathankinlay.com/
- How I Use The 1-1-1 Options Strategy To Fund My Lifestyle – YouTube, accessed March 31, 2026, https://www.youtube.com/watch?v=vOKxR_1hMsg
- Beating The Financial Futures Mkts – Combining Small Biases Into Money Making Strategies – Collins 2006 | PDF | Day Trading – Scribd, accessed March 31, 2026, https://www.scribd.com/doc/62872102/Beating-the-Financial-Futures-Mkts-Combining-Small-Biases-Into-Money-Making-Strategies-Collins-2006
- 1-1-2 strategy : r/thetagang – Reddit, accessed March 31, 2026, https://www.reddit.com/r/thetagang/comments/16iapjv/112_strategy/
- 111 Put Option Trade in /MES Futures (Part 1) – YouTube, accessed March 31, 2026, https://www.youtube.com/watch?v=pMl2Si04aEg
- Anatomy of the Trading Process: Empirical Evidence on the Behavior of Institutional Traders – University of Pennsylvania, accessed March 31, 2026, https://repository.upenn.edu/bitstreams/3426b9d3-65af-4afa-82d4-446198ec1a57/download
- (PDF) Stealth Trading in Options Markets – ResearchGate, accessed March 31, 2026, https://www.researchgate.net/publication/227349323_Stealth_Trading_in_Options_Markets
- Systematic Strategies Across Asset Classes – CME Group, accessed March 31, 2026, https://www.cmegroup.com/education/files/jpm-systematic-strategies-2013-12-11-1277971.pdf
- A Pairs Trading Strategy on Fractionally Cointegrated Implied Volatility of S&P 500 Equities – Research@CBS, accessed March 31, 2026, https://research-api.cbs.dk/ws/portalfiles/portal/105668682/1732152_A_Pairs_Trading_Strategy_on_Fractionally_Cointegrated_Implied_Volatility.pdf
- Intraday information from S&P 500 index futures options – Institutional Knowledge (InK) @ SMU, accessed March 31, 2026, https://ink.library.smu.edu.sg/context/lkcsb_research/article/7402/viewcontent/____Intraday_information_from_S_P_500_Index_Futures_Options.pdf
- 112 – risks : r/thetagang – Reddit, accessed March 31, 2026, https://www.reddit.com/r/thetagang/comments/1d0vcl1/112_risks/
- 1-1-2 Strategy : r/thetagang – Reddit, accessed March 31, 2026, https://www.reddit.com/r/thetagang/comments/18ecyze/112_strategy/
- Downside of 112 options strategy (youtube inside) – Reddit, accessed March 31, 2026, https://www.reddit.com/r/options/comments/18c3jrz/downside_of_112_options_strategy_youtube_inside/
- This 1-1-1 Trade Will Print Money – YouTube, accessed March 31, 2026, https://www.youtube.com/watch?v=BPdMXChPJ14
- Basics of a “Delta Buster” – Options Workshop | tastylive, accessed March 31, 2026, https://www.tastylive.com/shows/options-workshop/episodes/basics-of-a-delta-buster-08-28-2019
- https://www.tastylive.com/sitemap-episode.xml, accessed March 31, 2026, https://www.tastylive.com/sitemap-episode.xml
- Why the Best Looking Strategies are Really the Worst (It’s NOT Overfitting) – Medium, accessed March 31, 2026, https://medium.com/@thewealthacademyyt/suffering-from-success-why-the-best-looking-strategies-are-really-the-worst-0067bf37a876
- A question on using options strategies (like the 112 to trade) for long-term portfolio growth, accessed March 31, 2026, https://www.reddit.com/r/thetagang/comments/1apeyvc/a_question_on_using_options_strategies_like_the/