

I’m starting to see a shift in the wind and preparing for it. Despite all the recent volatility, it’s actually been a profitable week for me. That said, I think the party may be close to ending and a larger selloff could be ahead.
Historically I’ve often stepped back from longer-term trades in March and April since they tend to be pullback months. Right now several macro factors are stacking up: the U.S. is now at war with Iran, oil prices are rising, tariff threats continue (which ultimately hurt U.S. manufacturers and consumers), inflation remains persistent, and U.S. Treasury yields have started rising again. When yields rise, it often signals money rotating out of equities and into safer assets.
I’ve been trading long enough to recognize when pressures begin to align. Situations like this can create a perfect storm and often precede broader market weakness.
I also have a friend who is an economic historian, involved in putting together a global consortium which studies long-term economic cycles and he warns me of such things to look out for. Our trading styles are different, but his macro observations are usually very sharp. While no one can predict the exact timing of a market panic, the charts are starting to look like a slow grind down from an all-time high that never made much sense in the first place.
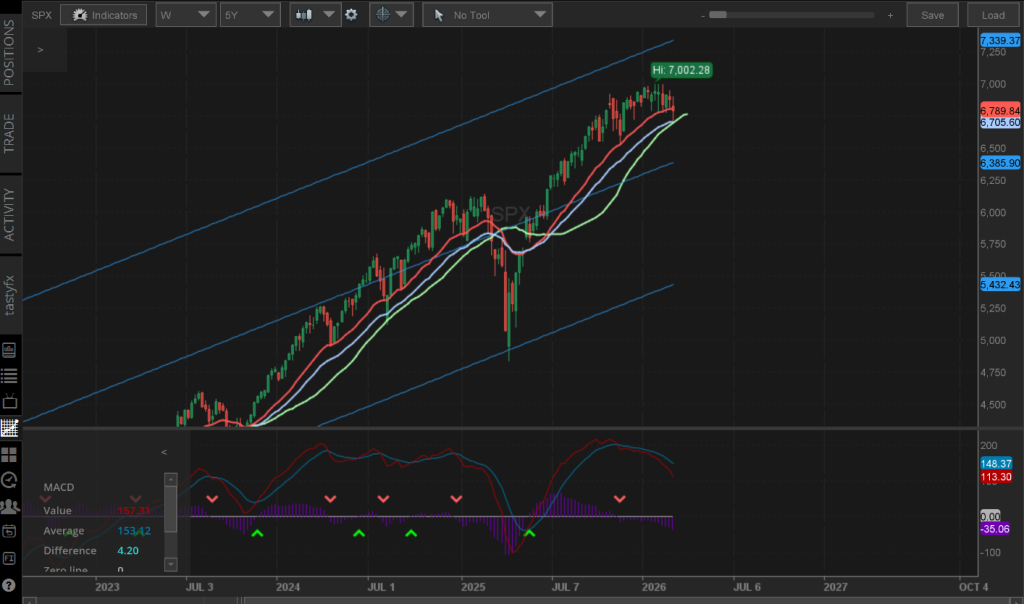
In my opinion, the market looks fragile and due for a typical 10% pullback. Whether that comes gradually or through a sharp panic move is anyone’s guess.
I’m not stepping away from trading like I have in past cycles, but I am shifting direction. A large portion of my capital is already parked in collateralized U.S. Treasuries, and I’ll be focusing more on options trades in the S&P 500 geared toward a downside move. I also have a few Poor Man’s Covered Calls open, and some underperforming ones will likely be closed.
Below are some of the structures I tend to use when positioning for a weaker market.
📉 SPX Bearish Options Cheat Sheet
(for the **S&P 500 Index / **SPX)
| Market Outlook | SPX Trade | Example Structure (SPX ~6800) | Why Traders Use It |
|---|---|---|---|
| Slight drift lower | Call Credit Spread | Sell 6950 / Buy 7000 | Collect premium if SPX stays below resistance |
| Slow grind down | Put Calendar | Sell Mar 6800 / Buy Apr 6800 | Benefits from time decay and elevated front-month IV |
| Moderate drop | Put Debit Spread | Buy 6800 / Sell 6700 | Simple directional trade with defined risk |
| Drop into a target zone | Put Broken Wing Butterfly | Buy 6900 / Sell 2×6800 / Buy 6600 | Low cost trade with strong payoff near the short strike |
| Controlled selloff | Put Ratio Spread | Buy 1×6850 / Sell 2×6750 | Cheap structure targeting a move toward the short strike |
| Crash scenario | Put Backspread | Sell 1×6800 / Buy 2×6700 | Large profit potential if the market collapses |
| Volatility spike + range | Double Calendar | 6700 put / 6900 call calendars | Profits from IV expansion and price staying in range |
⚡ Most Common SPX Trades During Selloffs
In practice, experienced index traders tend to favor:
1️⃣ Put Broken Wing Butterflies
2️⃣ Call Credit Spreads
3️⃣ Double Calendars
Why these structures?
- Defined risk
- Capital efficient
- Benefit from rising volatility
These allow traders to stay active even in uncertain markets while keeping risk controlled.
I’m a bit of an economics nerd and recently went down the rabbit hole and watched this 1-hour lecture, a good breakdown on tariffs and the broader economy:
Leave a Reply