
Trading options often looks like a shortcut to steady cash flow—almost like collecting monthly rent on stocks you own. But trading options without strict risk control is like walking across a frozen lake in early spring: the ice feels smooth and solid 99% of the time, giving you a false sense of security—until you step on the one hidden patch of thin ice and fall into freezing water in an instant.
Every year, thousands of smart investors with backgrounds in tech, science, and math try their hand at options trading. They know how to build complex software, solve equations, and analyze big data. So it seems logical that they could use math to “crack the code” of the stock market.
Yet, many of these sharp minds end up losing money. Why does a math model that worked perfectly on past stock charts break down in real life?
The Hard Data: This isn’t just a theory—it’s proven by major university studies and government data. Researchers at MIT Sloan and Stanford found that retail option traders lost approximately $3 billion over a decade. Another study published in the Journal of Finance found that retail options accounts lost $2.1 billion in just 20 months. Official government disclosures show that 9 out of 10 active retail options traders lose money.
The answer comes down to one big mistake: treating the stock market like a mechanical machine instead of a living, unpredictable crowd.
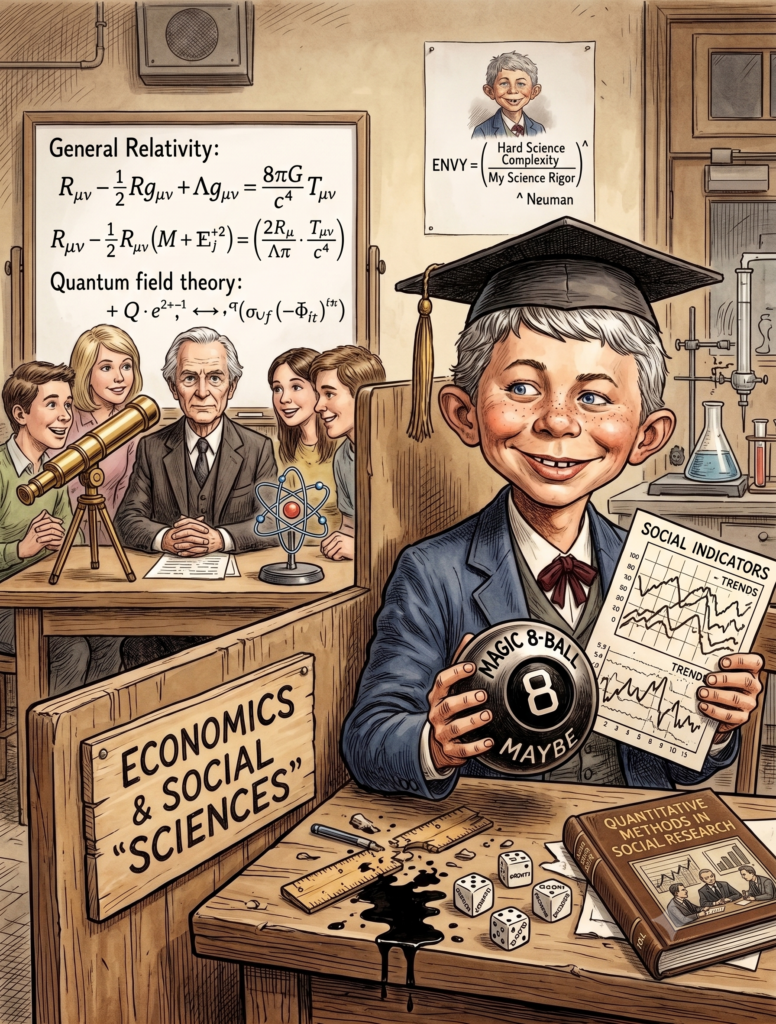
The Big Mistake: “Physics Envy”
Top economists call this mistake “physics envy”. Leading experts at MIT point out that in physics, you play against nature, and nature follows strict, unchanging laws. If you place a 10-ton truck on a steel bridge, the steel bends by an exact, mathematically predictable amount every single time.
Financial markets do not work like that. In finance, you are trading against other human beings and high-speed computers whose feelings, panic levels, and rules change constantly.
Here are four big reasons why market math is completely different from engineering:
- The Rules Change When You Start Playing: In physics, measuring a steel beam doesn’t change how strong the metal is. But in trading, when people discover a strategy that makes money, everyone rushes in to copy it. Studies show that after a profitable trading strategy is published in academic papers, its profits drop by 35% to 58% because too many people start using it.
- Past Charts Cannot Predict Future Human Behavior: Engineers test airplane wings in wind tunnels before flying. Traders test rules on past price charts (known as a “backtest”), but backtests only show past prices—they cannot predict future human behavior or sudden panics. Driving a trading strategy based only on past backtests is like trying to drive a car forward while looking only in the rearview mirror.
- Flawed Model Assumptions (The Volatility Direction Trap): Standard option pricing formulas (like the Black-Scholes model) assume that a stock’s volatility is the same whether the market goes up or down. In the real world, stock markets get much more volatile when prices crash. Because fear spikes when stocks fall, a combination trade (like an at-the-money “straddle”) that math formulas claim is completely neutral is actually downside-heavy in real life.
- Giant “Impossible” Storms Happen All the Time: Physical systems follow standard “bell curve” statistics, where extreme disasters beyond safety limits are ultra-rare. In the stock market, giant crashes happen far more often than standard math says they should.
- Real-World Proof: In August 2011, the S&P 500 stock index crashed by $7.08\sigma$ (7.08 standard deviations) in a single day. Standard Black-Scholes option models calculated the odds of a $7.08\sigma$ crash as less than 1 in a trillion—and a $5.25\sigma$ move as less than 1 in 14 million—yet both happened in real life.
| Engineering World | Financial Market World |
| Fixed laws of nature | Rules change as people react |
| Tested safely in wind tunnels & labs | Only past backtests (which can’t predict human behavior) |
| Extreme disasters are very rare | Huge crash events happen frequently |
| Fine-tuning parts makes things safer | Fine-tuning models on past data (known as “curve-fitting”) ruins performance |
High-Tech Market Bots: Trading in a Digital Jungle
Many analytical thinkers assume the stock market is just a puzzle waiting to be solved. In reality, today’s stock market is full of powerful algorithms and artificial intelligence (AI) systems designed to outsmart everyday traders.

These high-speed computers affect everyday investors in four main ways:
- Hunting for Stop-Losses: Bridges don’t try to trick you, but trading algorithms do. Large trading algorithms actively look for where everyday investors place orders designed to limit losses (known as “stop-loss orders”). The algorithms deliberately push stock prices down to trigger those stop-loss sales, grabbing cheap shares before sending the price right back up.
- Microsecond Logic: Today’s AI models process massive amounts of order data in microseconds. They ignore simple chart patterns like “moving averages” that retail traders rely on.
- Automated Panic Cascades: When bad news breaks, hundreds of trading bots read headlines instantly. Because many bots share similar safety rules, they all sell at the exact same moment. This creates instant “flash crashes” where prices plummet in seconds (like the famous 2010 Flash Crash that erased $1 trillion in 36 minutes, or the 2018 “Volmageddon” crash).
- Same-Day (0DTE) Options Risk: Options that expire on the exact same day (known as 0DTE, or Zero Days to Expiration) have exploded in popularity. Because these options are hours away from expiring, their price sensitivity (known as “gamma risk”) is supercharged. A tiny stock wiggle late in the day can cause a 0DTE option’s price to jump or crash by 100% or more in seconds, wiping out everyday traders.
Market Makers: The Hidden Plumbing Behind Options
To understand why options prices jump around unexpectedly, you have to look at market makers. Market makers are big financial institutions that make sure there is always a buyer when you want to sell, and a seller when you want to buy.
How Market Makers Price Options: The Dice Game Analogy
How does a market maker know what an option is worth? They calculate its theoretical value using probability.
Imagine a game where you roll a 6-sided die and get paid whatever number lands face up ($1 to $6) [cite: 1]. On average, rolling a die pays out $3.50 ($\frac{1+2+3+4+5+6}{6} = 3.50$). That $3.50 is the “theoretical value”. A market maker in die-rolls won’t pay $3.50; they might offer to buy your turn for $3.35 (the bid) or sell a turn for $3.65 (the ask), earning a $0.15 profit spread for taking the risk.
When setting quotes in real stock markets, a market maker asks three basic questions:
- What does the marketplace think a contract is worth? (Supply and demand)
- What does my mathematical pricing model think it’s worth? (Probability & expected value)
- What risky trades am I ALREADY holding on my books? (Inventory risk)
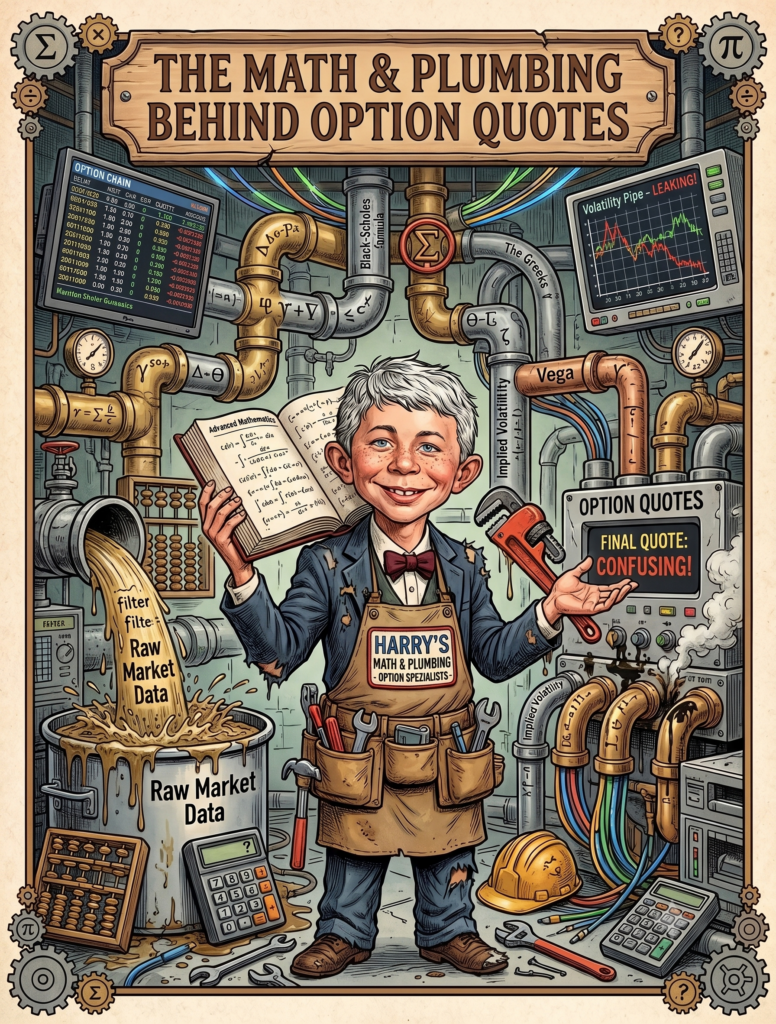
The Math & Plumbing Behind Option Quotes
Understanding this hidden plumbing reveals why options behave so unpredictably:
- Put-Call Parity & Free-Money Arbitrage: Option prices are locked together by a mathematical equation called Put-Call Parity. It states that the price of a Call option minus a Put option must equal the Stock price minus the strike price ($C – P = S – K$). If option prices get even slightly out of balance, market makers instantly execute a “conversion trade” (buying the stock, buying the put, and selling the call) to lock in free risk-free profit (arbitrage).
- Dynamic Hedging (Harvesting Option Value): When a market maker buys a call option from a trader, they don’t pray for the stock to go up. Instead, they immediately sell shares of the underlying stock to become “delta-neutral” so that small stock moves don’t hurt them. As the stock price wiggles up and down, they continuously buy and sell stock to re-balance their position. Adding up all those tiny re-balancing trades over time is how market makers harvest the option’s theoretical value in real life.
- Shifting Quotes Without Stock Movement: A trader might ask a market maker for an option price, walk away for 15 minutes, and return to find the price has changed—even though the stock price and volatility didn’t move at all. Why? Because during those 15 minutes, the market maker took on other risky trades. To re-balance their inventory, they lowered or raised their buying and selling prices to discourage trades on one side and encourage trades on the other.
- Forced Selling Cascades: When regular investors buy downside put options for protection, market makers take the other side of those trades. To protect themselves as the stock drops, market makers are forced by their own math formulas to sell shares of stock into the falling market. This forced selling pushes stock prices down even faster, causing a self-reinforcing panic cascade.
- Payment for Order Flow (PFOF): Most popular retail brokers don’t send your option orders directly to a public stock exchange. Instead, they sell your orders to wholesale market makers for cash—a process called Payment for Order Flow (PFOF). Market makers buy these orders because everyday retail trades are considered “uninformed” (less likely to be driven by institutional insider knowledge). This allows market makers to comfortably collect the difference between the buy and sell price (the bid-ask spread) on every trade.
- Volatility Contango vs. Backwardation: In calm, quiet markets, traders expect future months to be more volatile than today (a “contango” market). But during severe market crashes, near-term volatility explodes way above long-term volatility (a “backwardation” market), causing option pricing models to shift violently.
- Vanishing Liquidity: Market makers are under no obligation to lose money to help you. When panic hits, market makers quickly pull back their quotes or widen the gap between buying and selling prices. A price level that looked like strong support on a chart can disappear in an instant when market makers step out of the way.
7 Common Trading Traps and Their Practical Fixes
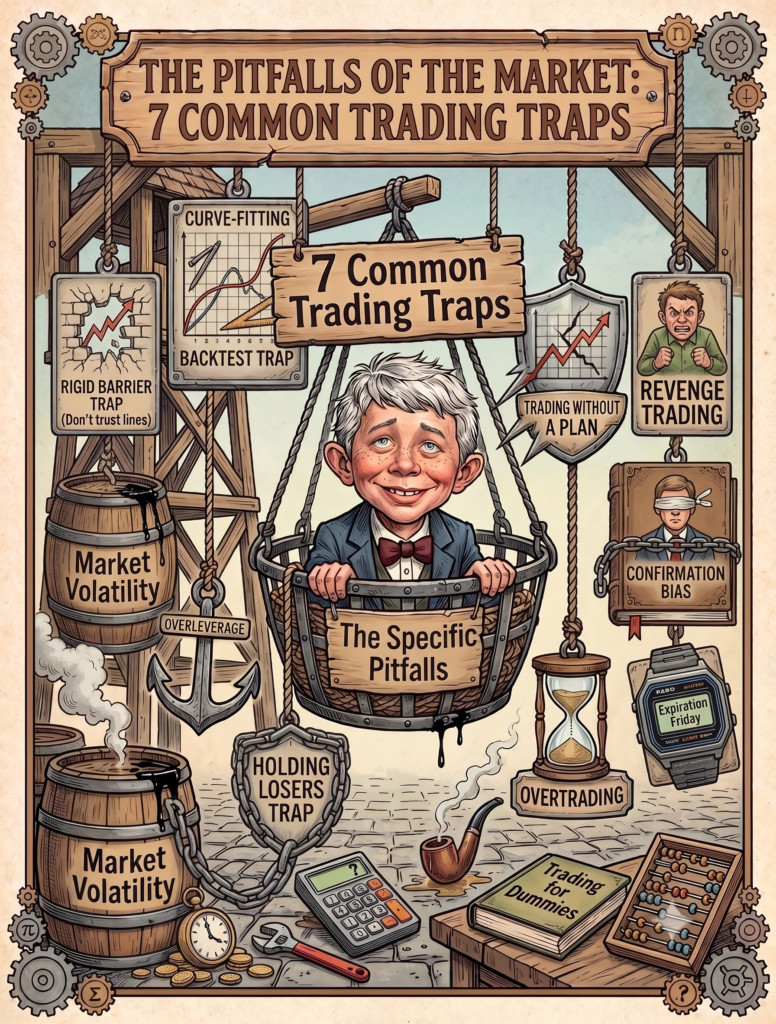
When everyday traders try to treat options like a strict science project, they fall into major traps. Here is how professional traders fix each problem:
1. Believing “95% Probability” Means Safe
- The Problem: Options software displays a high success rate (Probability of Profit) assuming smooth market moves. Unprotected short options with high success rates can still suffer complete account wipeouts during a sudden $7\sigma$ crash.
- The Practical Fix: Trade Defined-Risk Spreads Only. Instead of selling unprotected “naked” options with unlimited loss potential, always trade defined-risk spreads (like vertical spreads or iron condors). Buying a protective long option leg caps your maximum possible loss, making your portfolio safe against market crashes.
2. Over-Tweaking Past Backtests & Risk of Ruin
- The Problem: Fine-tuning settings until a past chart looks perfect (“curve-fitting”) just memorizes random historical noise, leading to real losses in live trading. Furthermore, backtests ignore path dependency—a bad streak of losses early on can cause a complete account wipeout (risk of ruin) before your long-term strategy ever has a chance to work.
- The Practical Fix: Keep Rules Simple & Test on Unseen Data. Demand simple trading rules with very few settings. Test rules on unseen historical timeframes or different stocks (Out-of-Sample testing) to make sure your edge isn’t just lucky noise.
3. The “Volatility Crush” Trap Around Big Events
- The Problem: Retail traders get lured by high option prices right before earnings or Fed news announcements. But right after the news is released, option values collapse instantly (known as volatility crush) as market makers re-price risk, handing retail traders fast losses.
- The Practical Fix: Enforce a News Blackout Rule. Do not open short option trades within 48 to 72 hours of major earnings or economic announcements.
4. The “Fast Exit” Illusion (Assuming You Can Always Get Out)
- The Problem: Backtests assume you can click “sell” and exit smoothly with a small loss. In real market panics, market makers widen the gap between buying and selling prices (spread blowouts), market prices skip over order levels (slippage), and buyers for specific options disappear entirely (liquidity vacuums).
- The Practical Fix: Size Trades for a 100% Loss & Avoid Market Stop-Orders. Size your trades small enough that even if liquidity vanishes and you lose 100% of the trade, your portfolio stays safe. Avoid using market stop-loss orders on options during panics, as bad pricing will execute your order at terrible prices.
5. Expiration “Pin Risk” and Weekend Price Gaps
- The Problem: Holding options all the way to Friday’s closing bell creates “pin risk”—if the stock price hovers near your target price, unexpected after-hours news can force you to buy expensive stock over the weekend.
- The Practical Fix: Follow the 21-to-7 Day Exit Rule. Always close or roll your options trades 1 to 3 weeks before expiration Friday. Closing early locks in most of your profit while completely eliminating pin risk, assignment traps, and weekend gap risks.
6. The “Holding Losers” Trap (The Disposition Effect)
- The Problem: Human psychology makes us want to hold onto losing trades hoping to break even. In options trading, this is deadly because options have a timer (known as time decay or theta). Every passing day shrinks the option’s value, turning small temporary pullbacks into 100% losses.
- The Practical Fix: Use Pre-Set Loss Limits & Time Caps. Set a strict loss limit (such as closing the trade if your loss hits 100% of the initial premium collected) before entering the trade. Pair this with a “time-stop” (closing the trade after a set number of days regardless of price).
7. Treating Chart Support Lines Like Concrete Walls
- The Problem: Treating chart support lines or volatility gauges (such as Implied Volatility Rank, or IVR) as solid physical floors. When market panic strikes, market makers step back and prices slice right through chart lines.
- The Practical Fix: Use Wide Volatility Buffers. Place your trade strikes far outside normal stock price channels instead of placing them directly on obvious chart lines.
| The Trading Trap | What Traders Believe | Real-World Reality | The Practical Fix |
| Probability Trap | “A 95% probability of profit means I can bet big.” | Models underestimate extreme crash risks, causing severe losses. | Trade Defined-Risk Spreads: Buy protective options to cap maximum potential loss. |
| Backtest Trap | “My backtest curve is smooth, so the formula works.” | Over-tuning memorizes past noise; ignores sequence risk of ruin. | Test Unseen Data: Demand simple rules that work across different time periods. |
| Vol Crush Trap | “High earnings premiums mean easy cash.” | Volatility collapses post-news, handing traders sudden losses. | News Blackout Rule: Avoid opening short option trades 48-72 hours before news. |
| Fast Exit Trap | “If a trade goes wrong, I’ll just sell immediately.” | Panic destroys liquidity; wide spreads and price jumps trap traders. | Size for 100% Loss: Size trades assuming liquidity vanishes; avoid market stops. |
| Pin Risk Trap | “Options close to expiration safely expire worthless.” | After-hours stock moves near strike prices trigger weekend gap risk. | 21-to-7 Day Exit Rule: Close positions weeks before expiration Friday. |
| Holding Losers Trap | “I’ll hold my losing trade until it breaks even.” | Time decay steadily erodes option value, turning pullbacks into total losses. | Pre-Set Loss & Time-Stops: Enforce automatic exit rules and time caps on every trade. |
| Rigid Barrier Trap | “Support lines and IV Rank will hold like a wall.” | Market makers pull liquidity during panics, making boundaries disappear. | Wide Volatility Buffers: Structure trades using broad volatility ranges rather than chart lines. |
Smart Takeaways for Everyday Investors
You don’t need a PhD in physics or a supercomputer to navigate options trading successfully, but you do need to abandon the idea that you can “crack” the market with a secret formula. Veteran market makers agree: long-term survival isn’t about finding a theoretical “secret edge”—it is 100% about managing risk and inventory when pricing models fail.
Here is how everyday investors can protect their money:
- Keep Trade Sizes Tiny: Never bet a large chunk of your portfolio on a single trade, no matter how high the theoretical probability of profit looks. A good rule of thumb is to never risk more than 1% to 2% of your total portfolio on any single options trade.
- Trade Defined-Risk Spreads: Avoid selling unprotected “naked” options. Buying protective option legs ensures that an unforeseen market crash cannot destroy your account.
- Enforce Automatic Exit Rules: Close out options positions early (1 to 3 weeks before expiration) to avoid pin risk, and cut losing trades mechanically rather than letting time decay swallow your position.
- Never Rely on Fast Exits or Event Gambling: Always structure trades assuming that if the market crashes, liquidity may evaporate. Avoid opening short options or 0DTE contracts right before earnings releases.
- Beware of Hidden Leverage and Margin Calls: Unlike owning shares of stock—where you can hold through a temporary market decline—options carry borrowed leverage. If a stock drops rapidly, your broker can demand extra cash (a “margin call”) or forcibly sell your position at the absolute bottom.
- Respect Liquidity: Stick to ultra-liquid, high-volume stocks and indices, and keep cash reserves to ride out market volatility.
References & Further Reading
- Bailey, D. H., Borwein, J. M., López de Prado, M., & Zhu, Q. J. (2014). Pseudo-Mathematics and Financial Charlatanism: The Effects of Backtest Overfitting on Out-of-Sample Performance. Notices of the AMS, 61(5), 458-471.
- Barber, B. M., & Odean, T. (2000). Trading Is Hazardous to Your Wealth: The Common Stock Investment Performance of Individual Investors. The Journal of Finance, 55(2), 773-806.
- Brunnermeier, M. K., & Pedersen, L. H. (2005). Predatory Trading. The Journal of Finance, 60(4), 1825-1863.
- Brunnermeier, M. K., & Pedersen, L. H. (2009). Market Liquidity and Funding Liquidity. The Review of Financial Studies, 22(6), 2201-2238.
- Bryzgalova, S., Pavlova, A., & Sikorskaya, T. (2023). Retail Options Trading. Working Paper, London Business School.
- Derman, E. (2011). Models.Behaving.Badly: Why Confusing Paperwork with Reality Leads to Disaster on Wall Street and in Life. Free Press.
- de Silva, S., Smith, A., & So, E. C. (2022). Losing is Optional: Retail Option Trading and Wealth Transfer. MIT Sloan School of Management & Stanford University Working Paper.
- Harvey, C. R., Liu, Y., & Zhu, H. (2016). … and the Cross-Section of Expected Returns. The Review of Financial Studies, 29(1), 5-68.
- Linnainmaa, J. T., & Roberts, M. R. (2018). The History of the Cross-Section of Stock Returns. The Review of Financial Studies, 31(7), 2623-2665.
- Lo, A. W., & Mueller, M. T. (2010). WARNING: Physics Envy May Be Hazardous to Your Wealth! Journal of Investment Management, 8(2), 13-63.
- McLean, R. D., & Pontiff, J. (2016). Does Academic Research Destroy Stock Return Predictability? The Journal of Finance, 71(1), 5-32.
- Securities and Exchange Board of India (SEBI) & FINRA Disclosures (2023). Study on Analysis of Profit and Loss of Individual Traders in Equity Derivatives Segment. Official Regulatory Market Microstructure Report.