
Understanding Delta, Theta, and Why Engineering Intuition Can Fail in Trading
If you spend any time in modern options trading forums or retail brokerage channels, you will notice a fascinating pattern: the community is absolutely packed with engineers, software developers, mathematicians, and physicists.
It makes perfect sense. Options are highly structural. Unlike buying a stock and simply hoping it goes up, options are built on elegant partial differential equations, standard deviations, probability density curves, and quantitative models. To anyone who loves solving complex, multi-dimensional puzzles, the options chain looks like the ultimate logical playground.
Many analytical minds enter this world with a highly intuitive belief: “If I can understand the mathematics well enough, I can beat the market.”
It is an understandable assumption. It is also one of the most dangerous fallacies a trader can fall into.
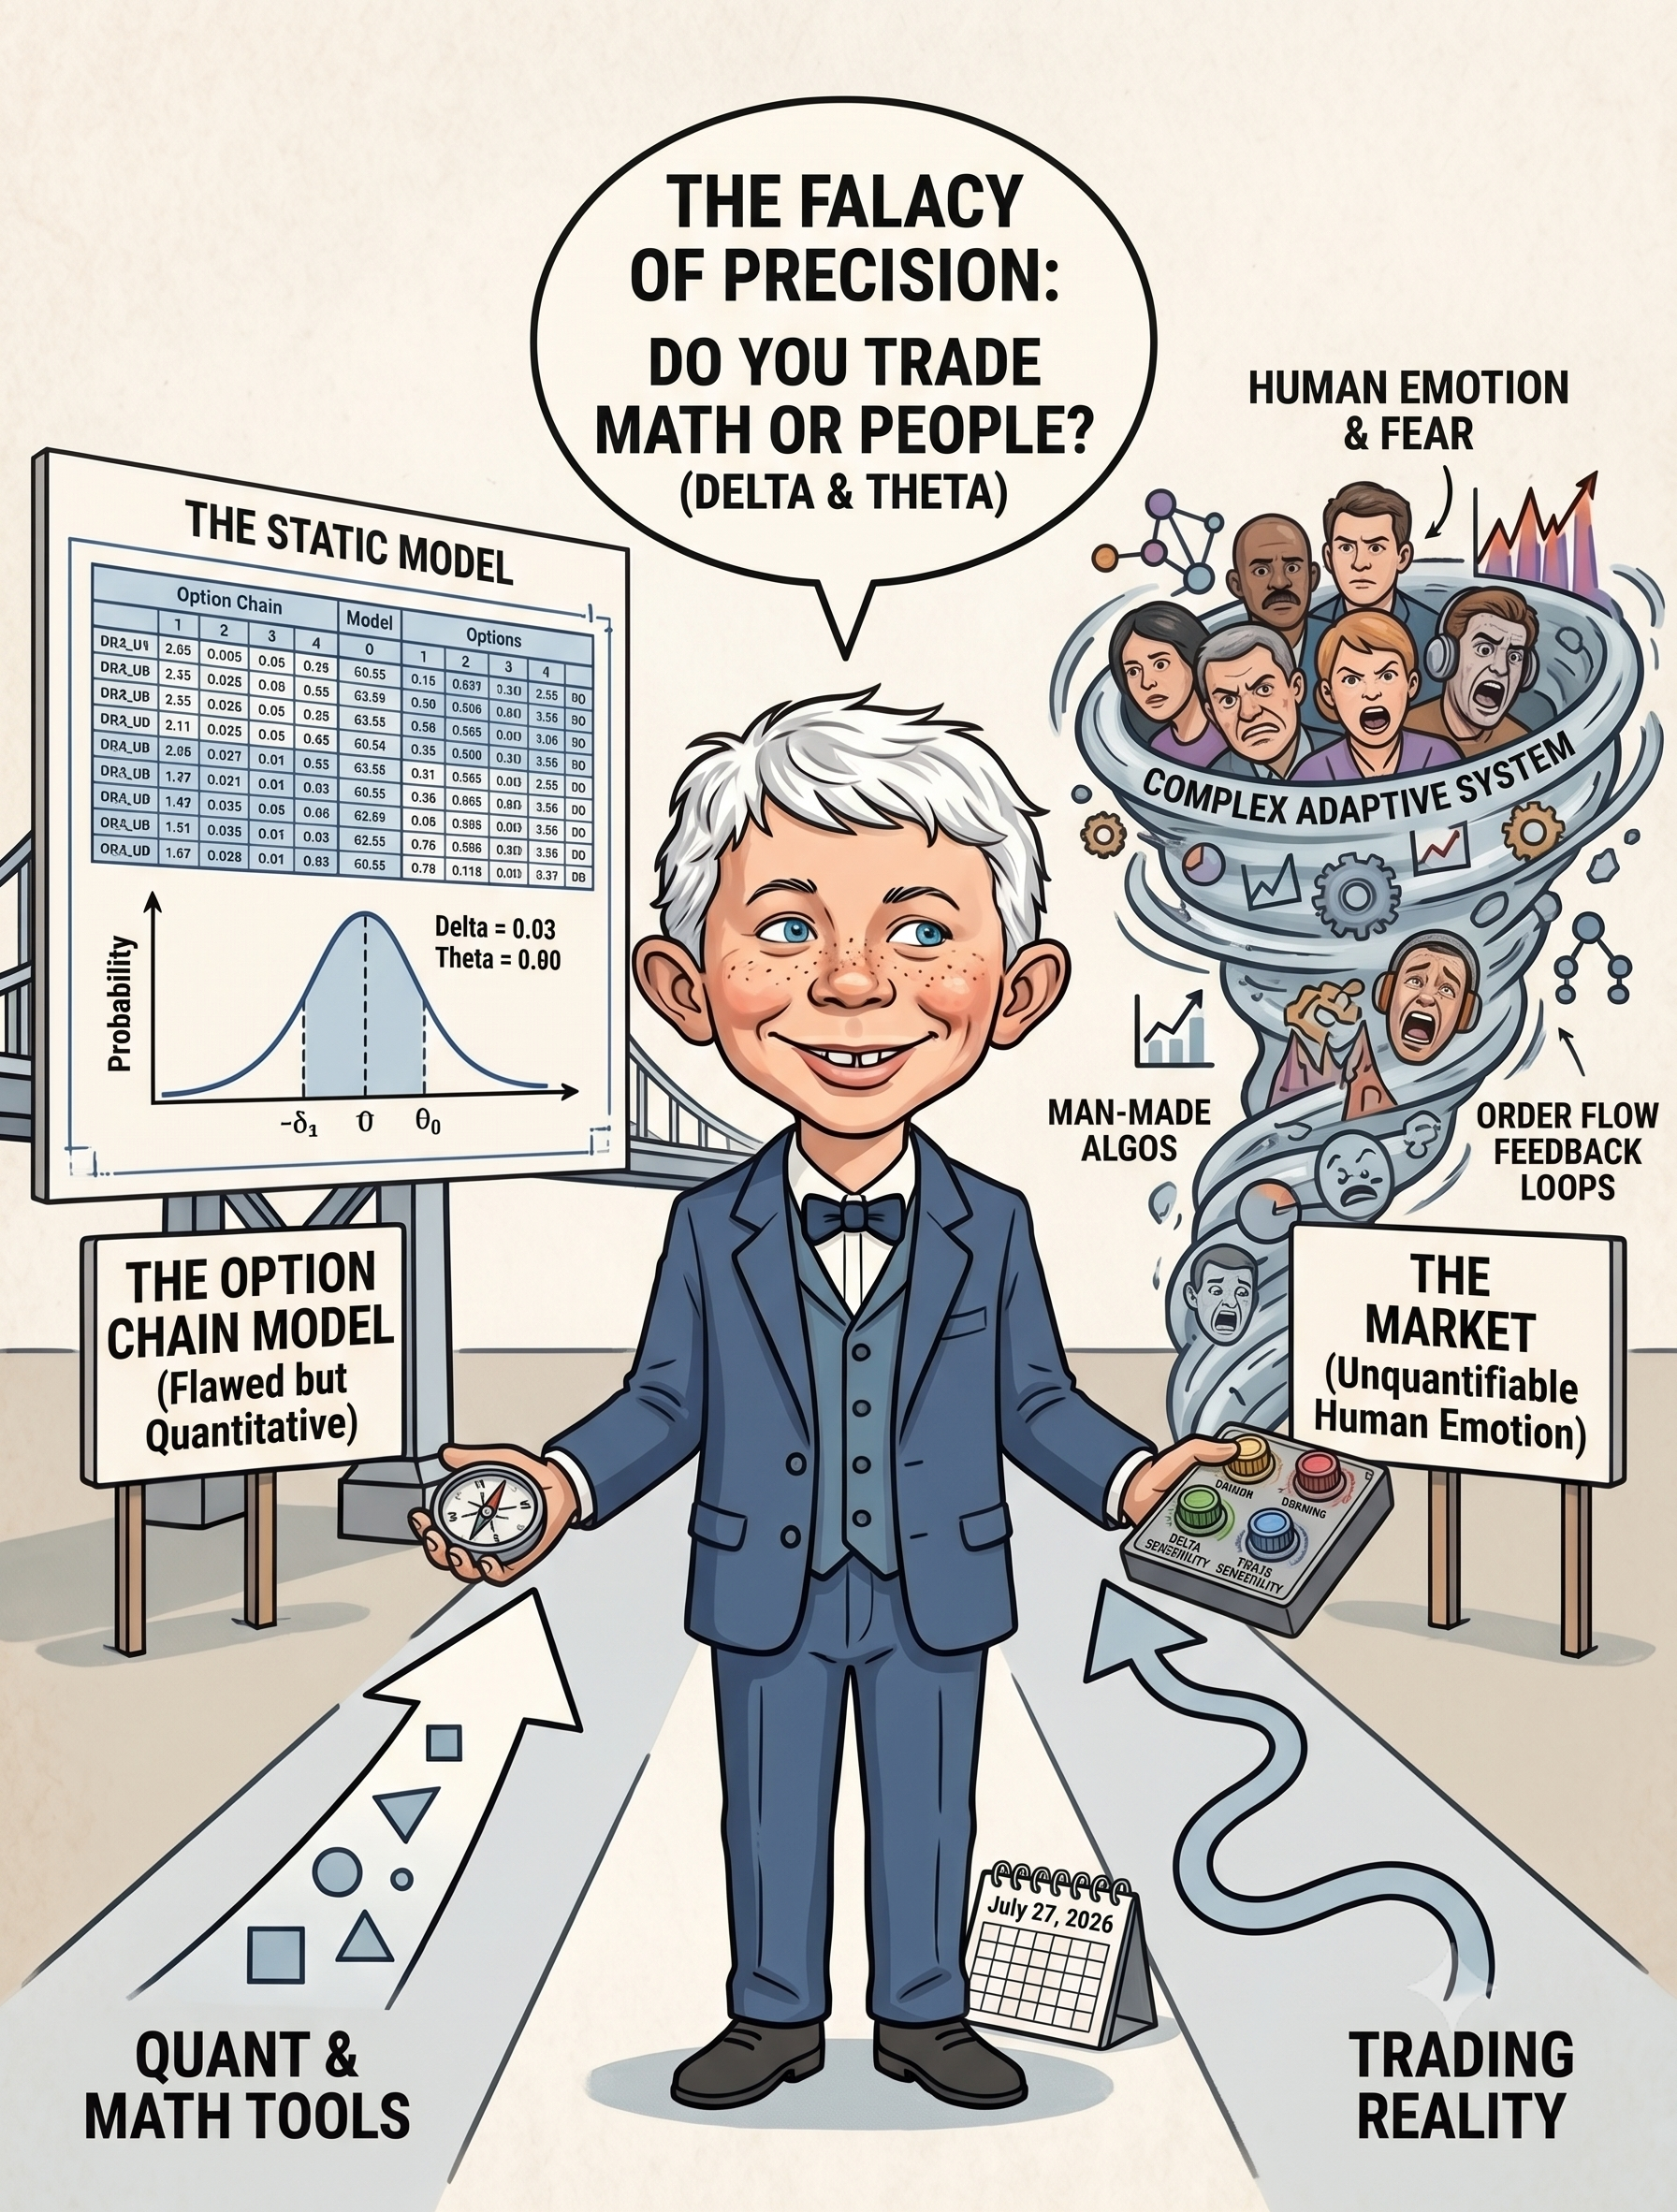
Bridges vs. Markets: The Adaptive Trap and “Physics Envy”
The fundamental disconnect lies in a behavioral trap known in academic finance as physics envy.
Quantitative minds are often trained to treat every problem as a deterministic system. In physical engineering, this mindset works beautifully:
- Bridges obey Newton’s laws of gravity and structural mechanics.
- Airplanes fly based on predictable fluid dynamics.
- Rocket boosters land on autonomous barges using closed-loop control theory.
If an engineering system behaves unexpectedly, the path forward is clear: gather more telemetry, run another simulation, tighten tolerances, and increase your precision. Crucially, a bridge is a passive structure—it doesn’t change its physical laws because too many trucks are crossing it.
In martial arts, breaking a wooden board in a studio is simple because the target is completely static. As Bruce Lee famously noted in Enter the Dragon, “Boards don’t hit back.”
In finance, markets do.
Markets are not static physical systems; they are complex adaptive systems driven by human emotion and man-made algorithms. It’s a common mistake to think automated trading algorithms are purely rational, cold machines. In reality, algorithms are programmed by humans to respond to order flow, volume spikes, and price velocity.
When human panic sets in, algorithms don’t calm the market—they react to that emotional selling by pulling liquidity, triggering automated stop-losses, and shorting momentum. The algorithms end up feeding on human irrationality, creating rapid, mechanical feedback loops that can cascade into flash crashes in seconds.
The moment a mathematical model is widely adopted to exploit a specific market pricing anomaly, the collective behavior of participants and algorithms shifts. They adapt, compress the anomaly, and render the static model obsolete.
The mathematical tools we use in options—known as the Greeks—are not crystal balls designed to predict the future. They are dynamic sensitivity control knobs designed to help us measure, standardize, and manage our exposure to uncertainty. Let’s look at the first two core control knobs on your trading dashboard: Delta and Theta.
Our Portfolio Case Study Baseline
To ground these concepts in reality, we will use a real-time snapshot of an active options portfolio split across an Individual margin account and a Roth IRA retirement account:

| Account Identifier | Net Liq | Options BP | Stock BP | P/L YTD | P/L YTD w/f | Delta | Theta | Vega | Ext | BP Usage % |
| Individual | $56,442.04 | $33,416.38 | $66,832.75 | $9,633.27 | $9,247.08 | +14 | +155 | -728 | $4,308 | 40.8% |
| Roth IRA | $81,307.96 | $8,376.24 | $8,376.24 | $7,475.95 | $7,297.57 | +105 | +275 | -1,240 | $5,946 | 89.7% |
| COMBINED TOTALS | $137,750.00 | $41,792.62 | $75,208.99 | $17,109.22 | $16,544.66 | +119 | +431 | -1,968 | $10,254 | 69.7% |
Delta (Δ): Your Speedometer & Probability Meter
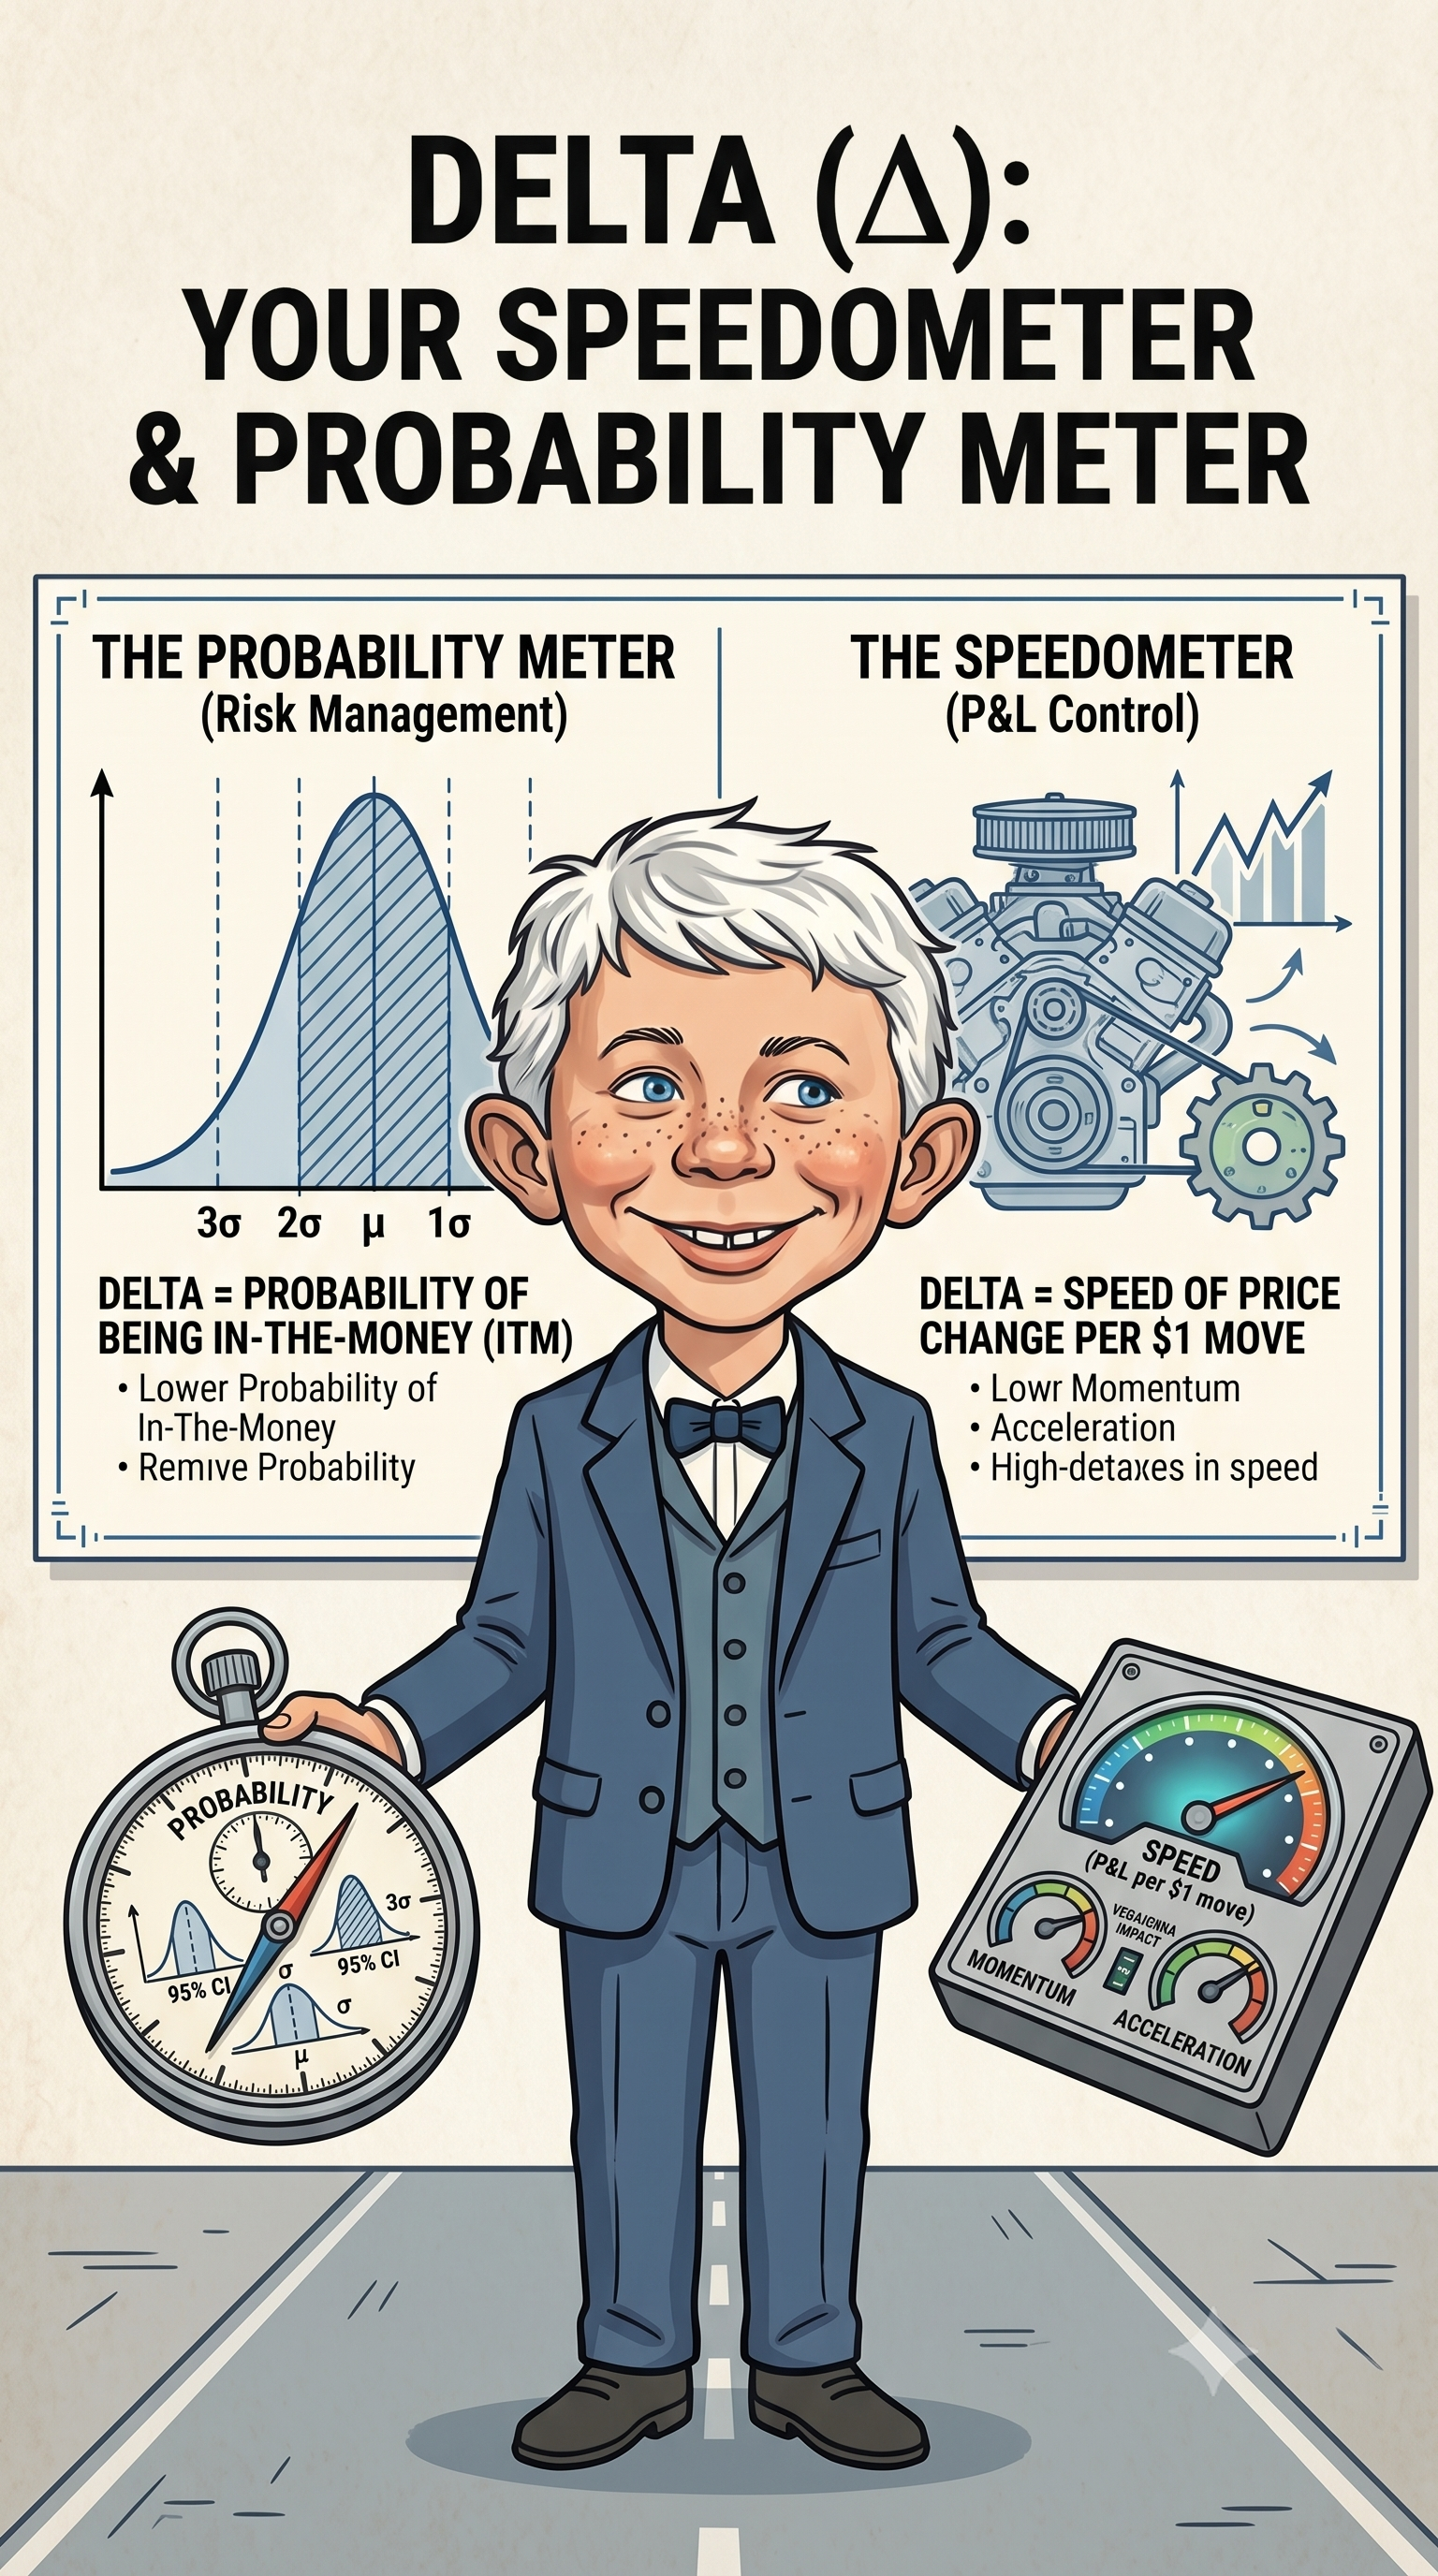
Under classical options pricing models, Delta measures the rate of change of an option’s theoretical value with respect to a change in the price of the underlying asset, holding all other variables constant:
Delta = Change in Option Value / Change in Stock Price
To trade options successfully, you need to look past the dry academic formula and understand Delta through two practical, real-world lenses:
1. The Speedometer
Delta tells you how fast your option’s price will move for every $1.00 move in the underlying stock. If you sell a put option, you are bullish and have positive Delta exposure. For example, selling a -30 Delta put option gives your portfolio +30 Delta. If the stock rallies by $1.00, the put option’s value drops (becomes cheaper to buy back) by $0.30, which increases your account’s P/L by $30.00.
2. The Probability Meter
In retail trading, Delta serves as a quick shortcut for probability. An option with a 16-Delta has roughly a 16% probability of expiring “in-the-money” (losing for the seller). This means that as an option writer selling that strike, you have an intuitive, statistically backed 84% probability of winning on that trade.
Normalizing Risk via Beta-Weighting
If your portfolio contains options on Apple, crude oil futures, gold, and emerging markets, you cannot simply add their nominal deltas together. A $1.00 move in gold represents a completely different risk profile than a $1.00 move in Apple.
To solve this, modern brokerage platforms use Beta-Weighting. This technique uses historical correlations and relative volatilities to normalize all of your scattered directional risks into equivalent shares of a single benchmark index—usually the S&P 500 ETF (SPY). It answers the vital question: “If the S&P 500 moves, how fast does my overall account value react?”
Looking at our combined portfolio totals, our aggregate Beta-Weighted Delta is +119.
- If SPY rallies by $1.00, our portfolio value will increase by approximately $119.00.
- If SPY drops by $1.00, our portfolio value will decline by approximately -$119.00.
We are not making wild directional bets; we have structured a gentle, positive “long” bias.
Theta (Θ): The Option Landlord’s Rent Collector
heta measures the sensitivity of an option’s theoretical value to the passage of calendar time (t), assuming price and volatility remain completely still:
Theta = Change in Option Value / Change in Time
Options are wasting assets—they have a strict expiration date. Because of this, they lose “time value” (extrinsic value) every single day. If you buy options, time decay is a silent leak constantly draining your account.
But if you sell options (known as premium writing), you are acting as the landlord. Every single day that ticks by on the calendar decays the price of the options you sold, allowing you to buy them back cheaper or let them expire worthless. Time decay becomes your daily rent collection.
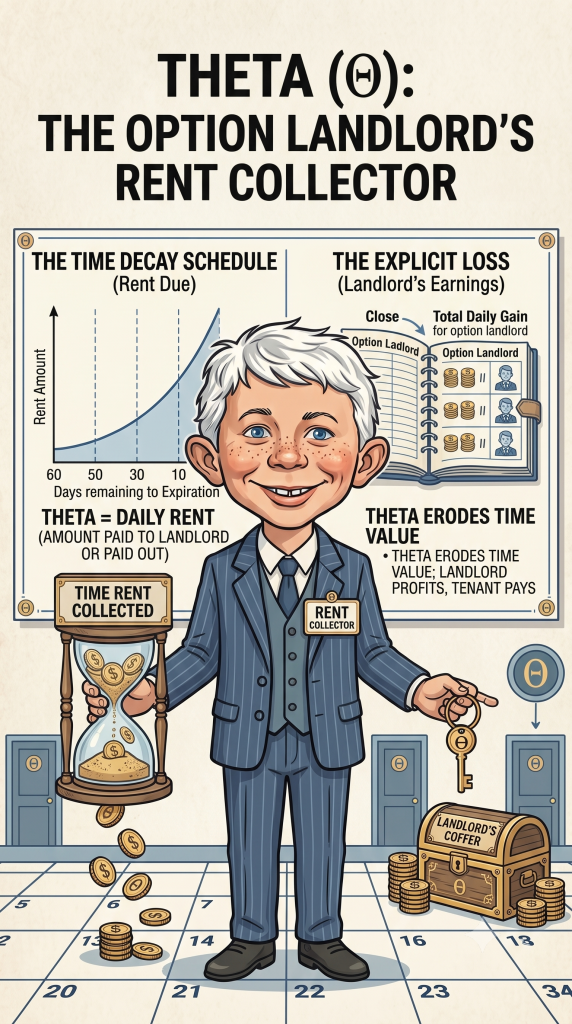
Looking at our combined metrics, our total daily Theta is +431. If the stock market goes completely sideways, stands completely still, and falls asleep for 24 hours, our portfolio theoretically captures $431.00 in cash simply because the clock ticked.
This is the beauty of selling premium—we do not have to guess exactly where a stock is going. We just establish “insurance boundaries” and let time do the heavy lifting.
The Balance Test: The Delta-to-Theta (Δ/Θ) Ratio
A professional premium seller doesn’t just look at high Theta and celebrate. They understand that yield always comes with directional risk.
If your directional risk (Delta) is too high relative to your daily time decay (Theta), you aren’t actually running a systematic “time-decay” business—you are just a directional speculator in a quantitative mask.
To measure this balance, we use the Delta-to-Theta Ratio popularized by research teams at tastylive:
Delta-to-Theta Ratio = | Beta-Weighted Delta / Theta |
Professional risk guidelines suggest keeping this absolute ratio below 2.0 (and ideally between 0.5 and 1.0) to ensure that time decay is the main driver of your account, not directional luck.
Let’s run our actual portfolio numbers:
Our Combined Ratio = 119 / 431 ≈ 0.28
At 0.28, our portfolio is in an incredibly healthy, neutral state. It tells us that our daily rent collection ($431.00) is more than strong enough to cushion daily directional spasms in the broad market.
The Dynamic Trap: Three Things You Must Know to Survive
If Delta and Theta were static, fixed constants, options trading would be a risk-free license to print money. But as any seasoned engineer knows, systems fail when hidden, dynamic forces are ignored.
Here are three brutal realities of the options market that often catch analytical minds off guard:
1. The Snapshot Fallacy: The Greeks Are Dynamic, Not Static
The Greeks displayed on your brokerage platform are real-time, theoretical estimates that change tick-by-tick. A portfolio dashboard snapshot is merely a frozen moment in time.
The second the market wiggles, your Delta and Theta instantly re-calculate. If the stock market drops rapidly, your Delta will not stay at a gentle +119. It will rapidly accelerate in the losing direction due to negative Gamma risk. The Greeks are a moving target, not a static blueprint.
2. Extrinsic Value Is Your “Fuel Tank”
Look at the column labeled Ext in our case study. Your Individual account has $4,308 in extrinsic value, and your Roth IRA has $5,946, totaling $10,254 of aggregate extrinsic value.
This is your “fuel tank.” It represents the maximum amount of theoretical premium left in the options you sold. As long as this number decays toward zero, you profit. However, if market sentiment shifts and panic sets in, this “fuel tank” can temporarily inflate (causing paper losses) even as calendar time passes.
3. The Buying Power Trap (A Tale of Two Accounts)
The most striking lesson in our real-world screenshot lies in the BP Usage % column:
- Individual Account (40.8% BP Usage): This is pristine risk management. You have roughly 60% of your account sitting in reserve as “dry powder”. If the market moves against you, you have plenty of capital to adjust or roll your positions.
- Roth IRA Account (89.7% BP Usage): This is highly aggressive and dangerous. Because retirement accounts restrict cash borrowing, standard Regulation T margin accounts grant leverage advantages that IRAs do not match due to regulatory margin restrictions on borrowing. This means you have almost zero margin for error. If a sharp market correction occurs, your margin requirements will expand, and you will have no buying power left to defend your trades, risking forced liquidation at the absolute worst time.
4. The Friction Drag (The “w/f” Column)
Notice the difference between our raw P/L YTD ($17,109.22) and our P/L YTD w/f ($16,544.66). That is a $564.56 drag in transaction costs, commissions, and fees.
If traders panic and try to micro-manage their Greeks tick-by-tick—rolling and adjusting every time the market wiggles—they will quickly chew up all of their theoretical edge in transaction costs and slippage. Professional trading requires the patience to let the daily spasms of the market play out without over-adjusting.
What’s Next?
Now that we have established how to construct our core time-decay engine, we must address the structural forces that can tear it apart.
In Part 2: The Snowball and the Storm, we will meet the risk managers:
- Gamma (Γ): The accelerator pedal that can turn a gentle market drift into a catastrophic avalanche overnight.
- Vega (ν): The fear index that can spike when market panic sets in.
- The AI Fallacy: Why automated algorithmic models do not remove emotion from the market, but instead may build rapid feedback loops that amplify human panic.