


⚠️ Personal Trade Research Disclaimer: I am not a financial advisor. The following analysis represents my own personal research conducted solely for the purpose of planning, tracking, and executing my own trades. Investing in highly volatile equities carries substantial risk. Always perform your own due diligence or consult with a licensed professional before putting capital at risk.
- My Focus Ticker: $OPEN
- Target Catalyst: Q2 2026 Earnings Release & “Financial Open House” (August 4, 2026)
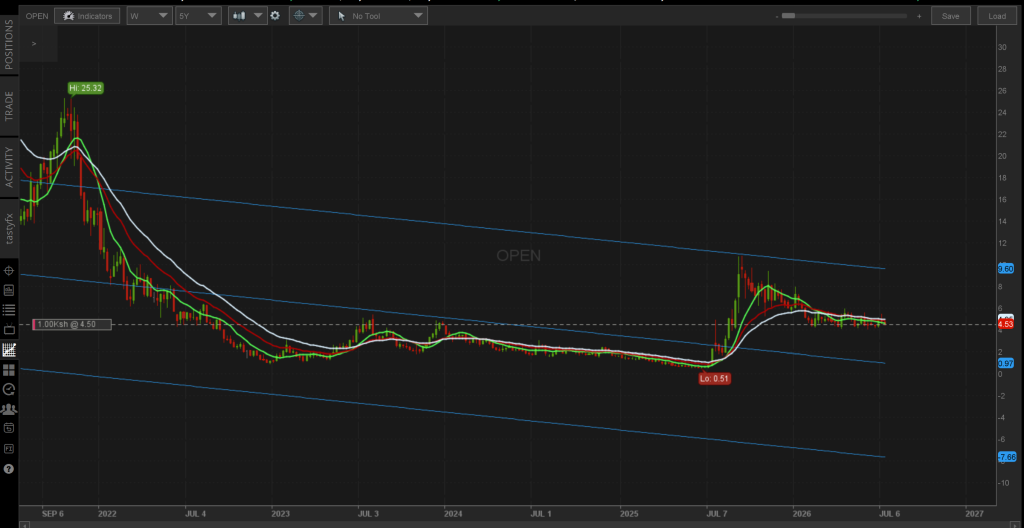
- My Entry Context Price: ~$4.50 (as of July 14, 2026)
- Underlying Risk Profile: Beta of 3.56 (High risk, high movement)
Executive Summary: The Core Thesis of My Position
For the last three years, mentioning Opendoor Technologies ($OPEN) on Wall Street provoked immediate skepticism. The pioneer of the high-volume, capital-intensive “iBuying” model was largely written off as a casualty of the Federal Reserve’s historic monetary tightening cycle. When mortgage rates spiked from 3% to over 7%, Opendoor was left holding billions of dollars of overvalued housing inventory that they had to liquidate at deep, equity-eroding losses.
Yet, ahead of the critical Q2 2026 earnings release on August 4th, I am seeing a quiet operational revolution take place. Under the leadership of CEO Kaz Nejatian, the company has executed a radical structural overhaul—coined “Opendoor 2.0”.
Because I plan to buy and hold this position into 2027, my investment thesis centers on a stark valuation mismatch. Opendoor currently trades at a trailing Price-to-Sales (P/S) ratio of 1.12x. This is a valuation usually reserved for distressed, slow-growth brick-and-mortar retailers. If Opendoor can prove on August 4th that it is Adjusted EBITDA profitable, I expect the market to begin re-rating the company as a high-margin e-commerce platform.
1. The Good: What Convinced Me on This Turnaround (My Bull Case)
- Velocity Over Speculation: Historically, Opendoor acted like a traditional real estate speculator, holding onto homes for months in search of top-dollar pricing. Today, I see them prioritizing speed over premium spreads. Aged inventory (homes held on market >120 days) plummeted to just 10% as of early 2026, down from over 51% in late 2025. For context, the broader, sluggish US housing market has an average aged inventory rate hovering around 33%.
- Radical Cost Containment: Opendoor’s structural breakeven point is vastly lower than it was during the housing boom. They have aggressively slashed corporate overhead, reducing fixed quarterly operating expenses to a lean $33 million in Q1 2026 (down from $39 million in Q1 2025).
- The Non-Recourse Debt Shield: A major factor that gives me confidence is Opendoor’s debt structure. In Q1 2026, the company carried $1.338 billion in total debt. However, $1.139 billion of that is non-recourse asset-backed debt tied strictly to home inventory. If the housing market crashes, lenders can only claim the underlying homes, not the parent company’s cash. With $999 million in cash and cash equivalents on hand as of March 31, 2026, Opendoor possesses a highly robust liquidity buffer that significantly outweighs its structural corporate debt.
- Low-Cost Sourcing via Partnerships: Rather than spending millions on expensive marketing, Opendoor is letting other platforms do the heavy lifting. By embedding their “Get a Cash Offer” button directly inside Zillow, Redfin, and Realtor.com, they acquire clients efficiently. In peak quarters, partnerships have accounted for up to 40% of Opendoor’s total home acquisitions.
2. The Bad: The Structural Risks I am Monitoring (My Bear Case)
- The “Higher-for-Longer” Rate Freeze: With mortgage rates expected to hover between 6.5% and 7.5% through 2026, the US housing market remains locked in. Homeowners with 3% pandemic-era mortgages refuse to move. If overall transaction volume remains severely depressed, I have to acknowledge that Opendoor cannot scale to the transaction density required to achieve true GAAP net income profitability.
- Persistent Analyst Selling Pressure: On July 13, 2026, analyst Ryan Tomasello of Keefe, Bruyette & Woods (KBW) raised the firm’s price target on OPEN from $2.25 to $2.65 but maintained a strict Underperform (Sell) rating. I am keeping an eye on the fact that institutional bears argue the stock trades at too steep a premium relative to its thin, cyclical margins, leaving no margin of safety.
- The J Capital Short Attack: On July 8, 2026, short-selling firm J Capital Research issued a cautious report, heavily criticizing the core mechanics of the model. They argued that after factoring in transaction fees, local remodeling overhead, and holding costs, the margins are too thin to ever support true GAAP profitability.
3. My Trade Execution Cheat Sheet (My Q2 Earnings Checklist)
To block out the market noise on August 4th, I am measuring the company’s performance strictly against these guided metrics:
- Revenue Target: ~$900 million (Up ~25% quarter-over-quarter from Q1’s $720 million).
- Contribution Margin Target: 5% to 7% (aiming for a 6% midpoint).
- Adjusted EBITDA Target: Breakeven (the primary catalyst).
The “Tight Math” on EBITDA Breakeven:
In Q1 2026, contribution profit was $32 million against an Adjusted EBITDA loss of $(31) million. If they hit the exact midpoint of Q2 guidance (a 6% contribution margin on $900 million in revenue), that yields $54 million in contribution profit. That leaves an approximate $9 million shortfall they must bridge via improved cost control or ancillary fees to achieve full EBITDA breakeven. Watching how they bridge this gap is my number one priority.
4. Invalidation Points (When I Will Sell)
A professional trade requires a strict exit plan. I will abandon this thesis and cut my position if:
- Aged Inventory Creeps Above 15%: This means homes are getting stuck. In a 7.5% interest rate environment, “sitting” on inventory means paying compounded interest, which quickly converts profitable flips into net losses.
- Contribution Margins Compress Below 5%: This proves their automated pricing algorithms cannot maintain healthy unit economics in a sluggish market.
- The Cash Runway Drops Rapidly: If cash reserves start dropping significantly below the $999 million mark without a clear, parallel reduction in their debt lines.
5. My Long-Term Outlook (1-to-2 Years)
Consensus estimates project Opendoor’s revenue to scale up dramatically to $6.80 billion in 2027 as their capital-light, fee-sharing partnerships scale up. This expansion can occur primarily through market share capture (currently under 0.5% of annual US home sales) without needing a macro housing recovery.
If the company hits its target of trailing 12-month adjusted net income profitability by the end of 2026, I expect the stock to undergo a massive, Carvana-style structural re-rating.
Master Financial Verification Index
- Opendoor Q1 2026 Financial Position Data: SEC Form 10-Q (Period Ended March 31, 2026) / Public.com OPEN Earnings & Financial Profile
- Opendoor Q2 2026 Corporate Guidance & Margin Structure: TS2 Tech Financial Market Analysis (July 2026)
- Russell 3000 Index Expansion Records (June 26, 2026 Reconstitution): Opendoor Investor Relations Press Release
- J Capital Research “Equity Dispatch” Short Report Details (July 8, 2026): Investing.com Financial Coverage
- Keefe, Bruyette & Woods (KBW) Rating Database (July 13, 2026 Target Adjustment): GuruFocus Real-Time Institutional Consensus Tracker
- Wall Street Consolidated Growth Projections & Long-Term Revenue Targets: Stock Analysis OPEN Long-Term Analytical Forecast Engine
- Opendoor Executive Management Framework & Strategy Overviews: Opendoor Official Investor Relations Management Portal