

Trading the $HOOD Earnings Hangover: A Rebound Play
When Robinhood ($HOOD) reported Q1 2026 earnings, the market focused heavily on the 47% drop in crypto transaction revenue, punishing the stock with a 14% slide. Identifying a “dead cat bounce” opportunity, I entered a multi-leg position on April 29 to capitalize on the overextended sell-off.
The Strategy: Synthetic Long with a Twist
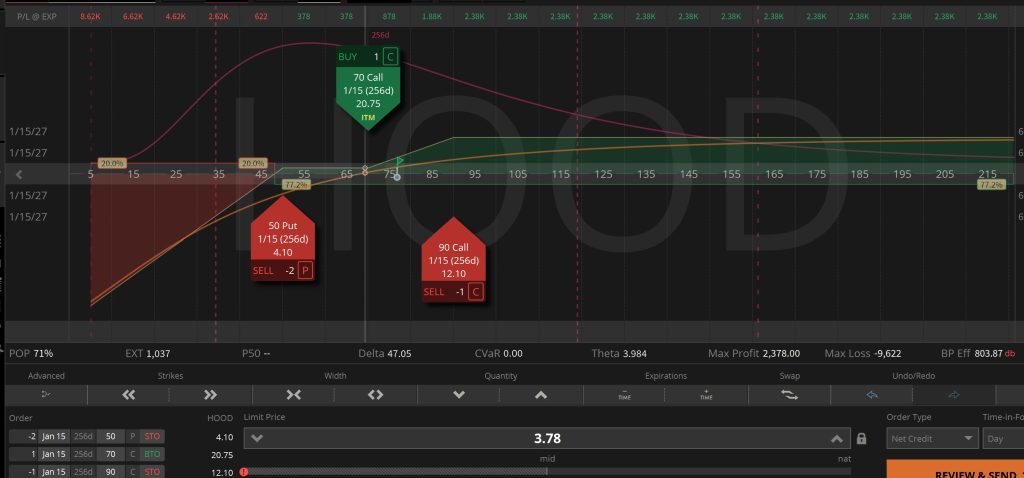
I utilized a custom combination of deep out-of-the-money (OTM) short puts and a long call spread. This structure provided a high-probability entry point while significantly lowering the cost of the upside exposure.
Trade Ledger & Performance

Opening Position (April 29, 2026)
| Quantity | Contract | Action | Price | Net Total (Incl. Fees) |
| 2 | Jan 15, 2027 50 Put | SOLD | $5.20 | $1,037.71 |
| 1 | Jan 15, 2027 70 Call | BOUGHT | $16.35 | -$1,636.12 |
| 1 | Jan 15, 2027 90 Call | SOLD | $9.76 | $974.85 |
| Total | Net Credit | $376.44 |
Closing Position (May 4, 2026)
| Quantity | Contract | Action | Price | Net Total (Incl. Fees) |
| 2 | Jan 15, 2027 50 Put | BOUGHT | $4.25 | -$850.25 |
| 1 | Jan 15, 2027 70 Call | SOLD | $20.20 | $2,019.83 |
| 1 | Jan 15, 2027 90 Call | BOUGHT | $12.45 | -$1,245.12 |
| Total | Net Debit | -$75.54 |
Final Result: $300.90 Profit
Quantitative Analysis: The Greeks in Action
This trade wasn’t just about the price moving up; it was about how the options reacted to the stabilization of the stock.
- Positive Delta (Price Direction): The primary driver. As $HOOD began its rebound from the $71 level, the $70 Call moved toward being “at-the-money” (ATM), gaining value rapidly. Simultaneously, the short $50 Puts became even more OTM, allowing us to buy them back $0.95 cheaper per contract.
- Negative Vega (Volatility Crush): Post-earnings implied volatility is usually inflated. By selling the $50 puts and the $90 call, we were “short” volatility. As the market calmed and the IV dropped, the premium on these legs evaporated, contributing to our profit.
- Theta (Time Decay): Although these are 2027 LEAPS, having a net credit entry meant that the passage of time worked in our favor. We collected $376.44 upfront, effectively getting paid to wait for the bounce to materialize.
The Bottom Line: Risk vs. Reward
Analyzing the capital efficiency of this trade reveals why these types of credit spreads are staples in a quantitative portfolio.
| Metric | Value | Notes |
| Gross Profit | $306.00 | Total gain before transaction costs. |
| Net Profit | $300.90 | Final realized gain after commissions and fees. |
| Max Risk (Collateral) | ~$6224 | Based on the $50 Put strikes minus the net credit received and if underlying price went to 0. |
| Return on Risk (5 Days) | 4.83% | An annualized return of over 350% if repeatable. |
| Transaction Efficiency | 98.3% | $300.90 net profit / $306.00 gross profit. |
Summary
By combining a short put spread with a long call spread, I was able to turn a volatile earnings miss into a controlled, high-probability winner. The trade captured the “bounce” perfectly, allowing for an exit in just five days with a solid return on risk.